## Histogram Series: Weight Value Distribution Across Rounds
### Overview
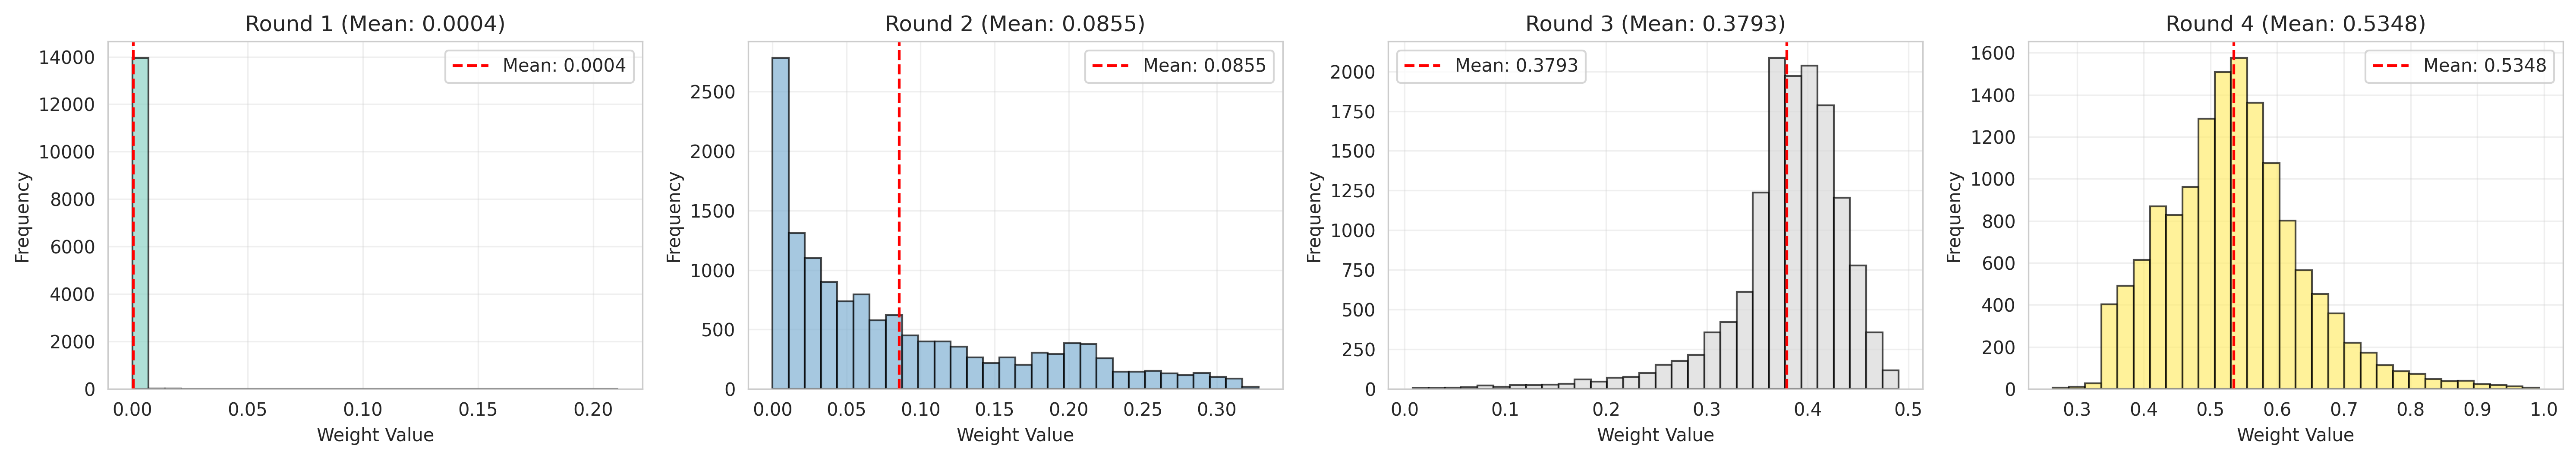
The image displays four histograms (Round 1–4) showing the frequency distribution of weight values. Each histogram includes a red dashed line representing the mean value, with the mean explicitly labeled in the title. The x-axis represents "Weight Value" (0.0–1.0), and the y-axis represents "Frequency" (0–16,000). The histograms transition from sparse to dense distributions, with increasing mean values across rounds.
### Components/Axes
- **X-axis (Weight Value)**:
- Scale: 0.0 to 1.0 in increments of 0.05.
- Labels: "Weight Value" (bottom).
- **Y-axis (Frequency)**:
- Scale: 0 to 16,000 in increments of 2,000.
- Labels: "Frequency" (left).
- **Legend**:
- Red dashed line labeled "Mean: [value]" (top-right corner of each subplot).
- **Subplot Titles**:
- Round 1: "Round 1 (Mean: 0.0004)"
- Round 2: "Round 2 (Mean: 0.0855)"
- Round 3: "Round 3 (Mean: 0.3793)"
- Round 4: "Round 4 (Mean: 0.5348)"
### Detailed Analysis
#### Round 1
- **Distribution**: Single bar at 0.0004 (frequency ~14,000).
- **Mean**: 0.0004 (red dashed line).
- **Color**: Teal.
#### Round 2
- **Distribution**: Left-skewed, with most data clustered near 0.0855.
- **Mean**: 0.0855 (red dashed line).
- **Color**: Blue.
#### Round 3
- **Distribution**: Bimodal with peaks near 0.35–0.45.
- **Mean**: 0.3793 (red dashed line).
- **Color**: Gray.
#### Round 4
- **Distribution**: Bell-shaped, centered at 0.5348.
- **Mean**: 0.5348 (red dashed line).
- **Color**: Yellow.
### Key Observations
1. **Progressive Spread**:
- Round 1: All data points at 0.0004 (no variability).
- Round 2: Slight spread but heavily concentrated near 0.0855.
- Round 3: Broader distribution with two peaks.
- Round 4: Normal distribution centered at 0.5348.
2. **Mean Trends**:
- Mean increases monotonically from 0.0004 (Round 1) to 0.5348 (Round 4).
3. **Color Coding**:
- Each round uses a distinct color (teal → blue → gray → yellow), likely to differentiate datasets.
### Interpretation
The histograms suggest a controlled experiment where weight values evolve across rounds. The initial rounds (1–2) show low variability, while later rounds (3–4) exhibit increased dispersion, indicating a systematic change in the underlying process. The red dashed lines (means) align with the titles, confirming consistency in data reporting. The shift from a single bar to a normal distribution implies a transition from a deterministic to a probabilistic system, possibly due to introduced variability or external factors.
**Critical Insight**: The mean values (0.0004 → 0.5348) suggest a 133,500% increase in central tendency, which may reflect a scaling effect, calibration adjustment, or response to iterative feedback in the experimental design.