## Diagram: Feature Analogy and Prediction Network
### Overview
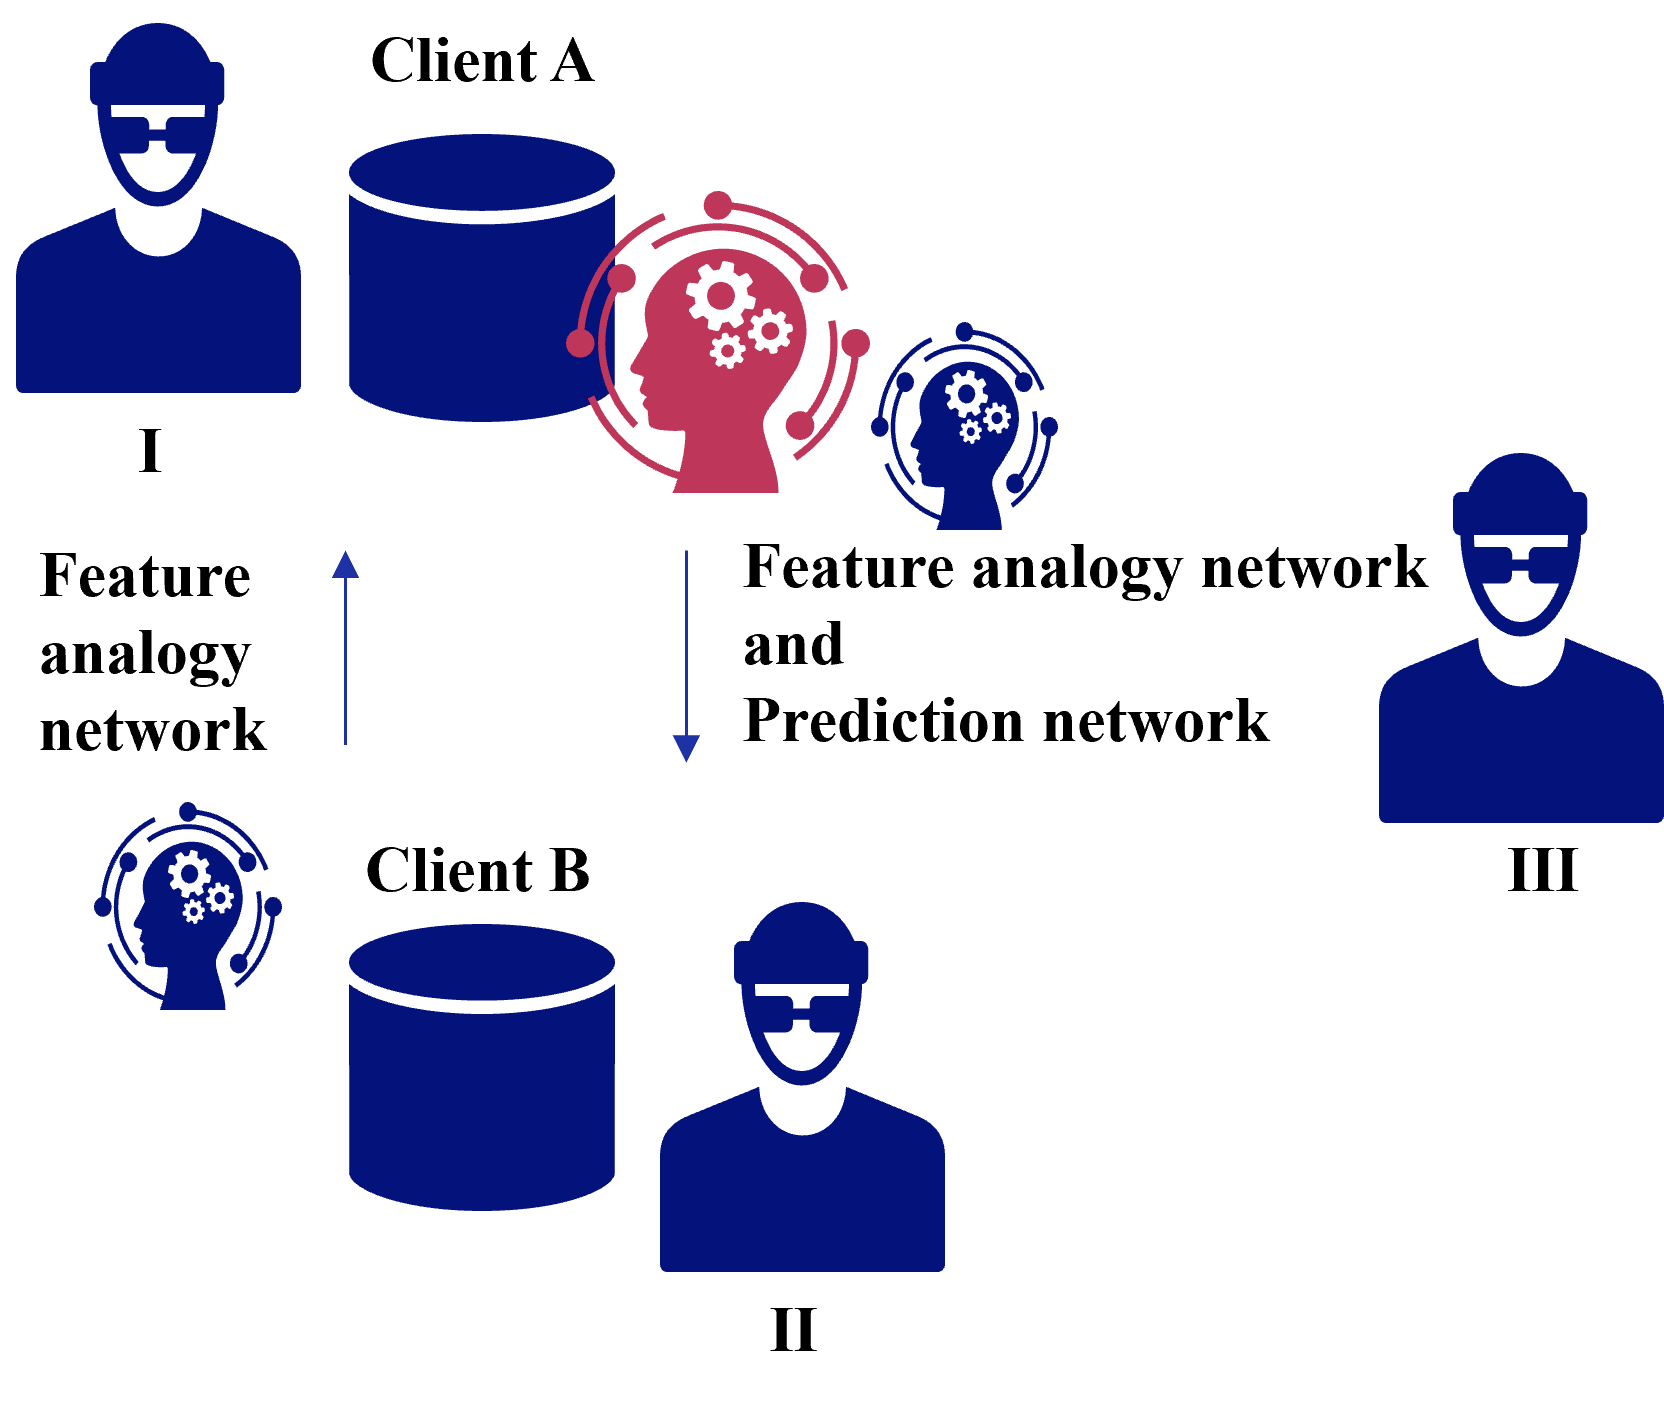
The image is a diagram illustrating a feature analogy and prediction network involving two clients (Client A and Client B) and three entities labeled I, II, and III. The diagram shows the flow of information and processing between these entities.
### Components/Axes
* **Clients:** Client A (top) and Client B (bottom) are represented with a label and a database icon.
* **Entities:** Three entities labeled I (top-left), II (bottom-center), and III (top-right) are represented by a user icon.
* **Networks:**
* "Feature analogy network" - connects entity I to Client B.
* "Feature analogy network and Prediction network" - connects Client A to Client B and entity III.
* **Processing Units:** Head icons with gears inside represent processing units. One is colored red and located near Client A, and the other is blue and located near Client B.
* **Arrows:** Arrows indicate the direction of information flow.
### Detailed Analysis
* **Client A:** Located at the top of the diagram. It is connected to entity I via the "Feature analogy network" (upward arrow). A red processing unit is located to the right of Client A.
* **Client B:** Located at the bottom of the diagram. It is connected to entity II. Client A is connected to Client B via the "Feature analogy network and Prediction network" (downward arrow). A blue processing unit is located to the left of Client B.
* **Entity I:** Located on the top-left.
* **Entity II:** Located on the bottom-center.
* **Entity III:** Located on the top-right.
* **Processing Units:** The red processing unit near Client A is larger than the blue processing unit near Client B.
### Key Observations
* The diagram illustrates a flow of information from Client A to Client B, and from entity I to Client B.
* The "Feature analogy network and Prediction network" connects Client A to Client B and entity III.
* The red processing unit near Client A might represent a more complex or intensive processing compared to the blue processing unit near Client B.
### Interpretation
The diagram depicts a system where Client A and Client B exchange information through feature analogy and prediction networks. Entity I provides input to Client B through a feature analogy network. The red processing unit near Client A suggests that Client A might be performing more complex processing or analysis compared to Client B. The connection between Client A, Client B, and entity III through the "Feature analogy network and Prediction network" suggests a collaborative or distributed processing model. The diagram highlights the relationships and information flow between different components in the system.