## System Architecture Diagram: Federated Learning with Feature Analogy Networks
### Overview
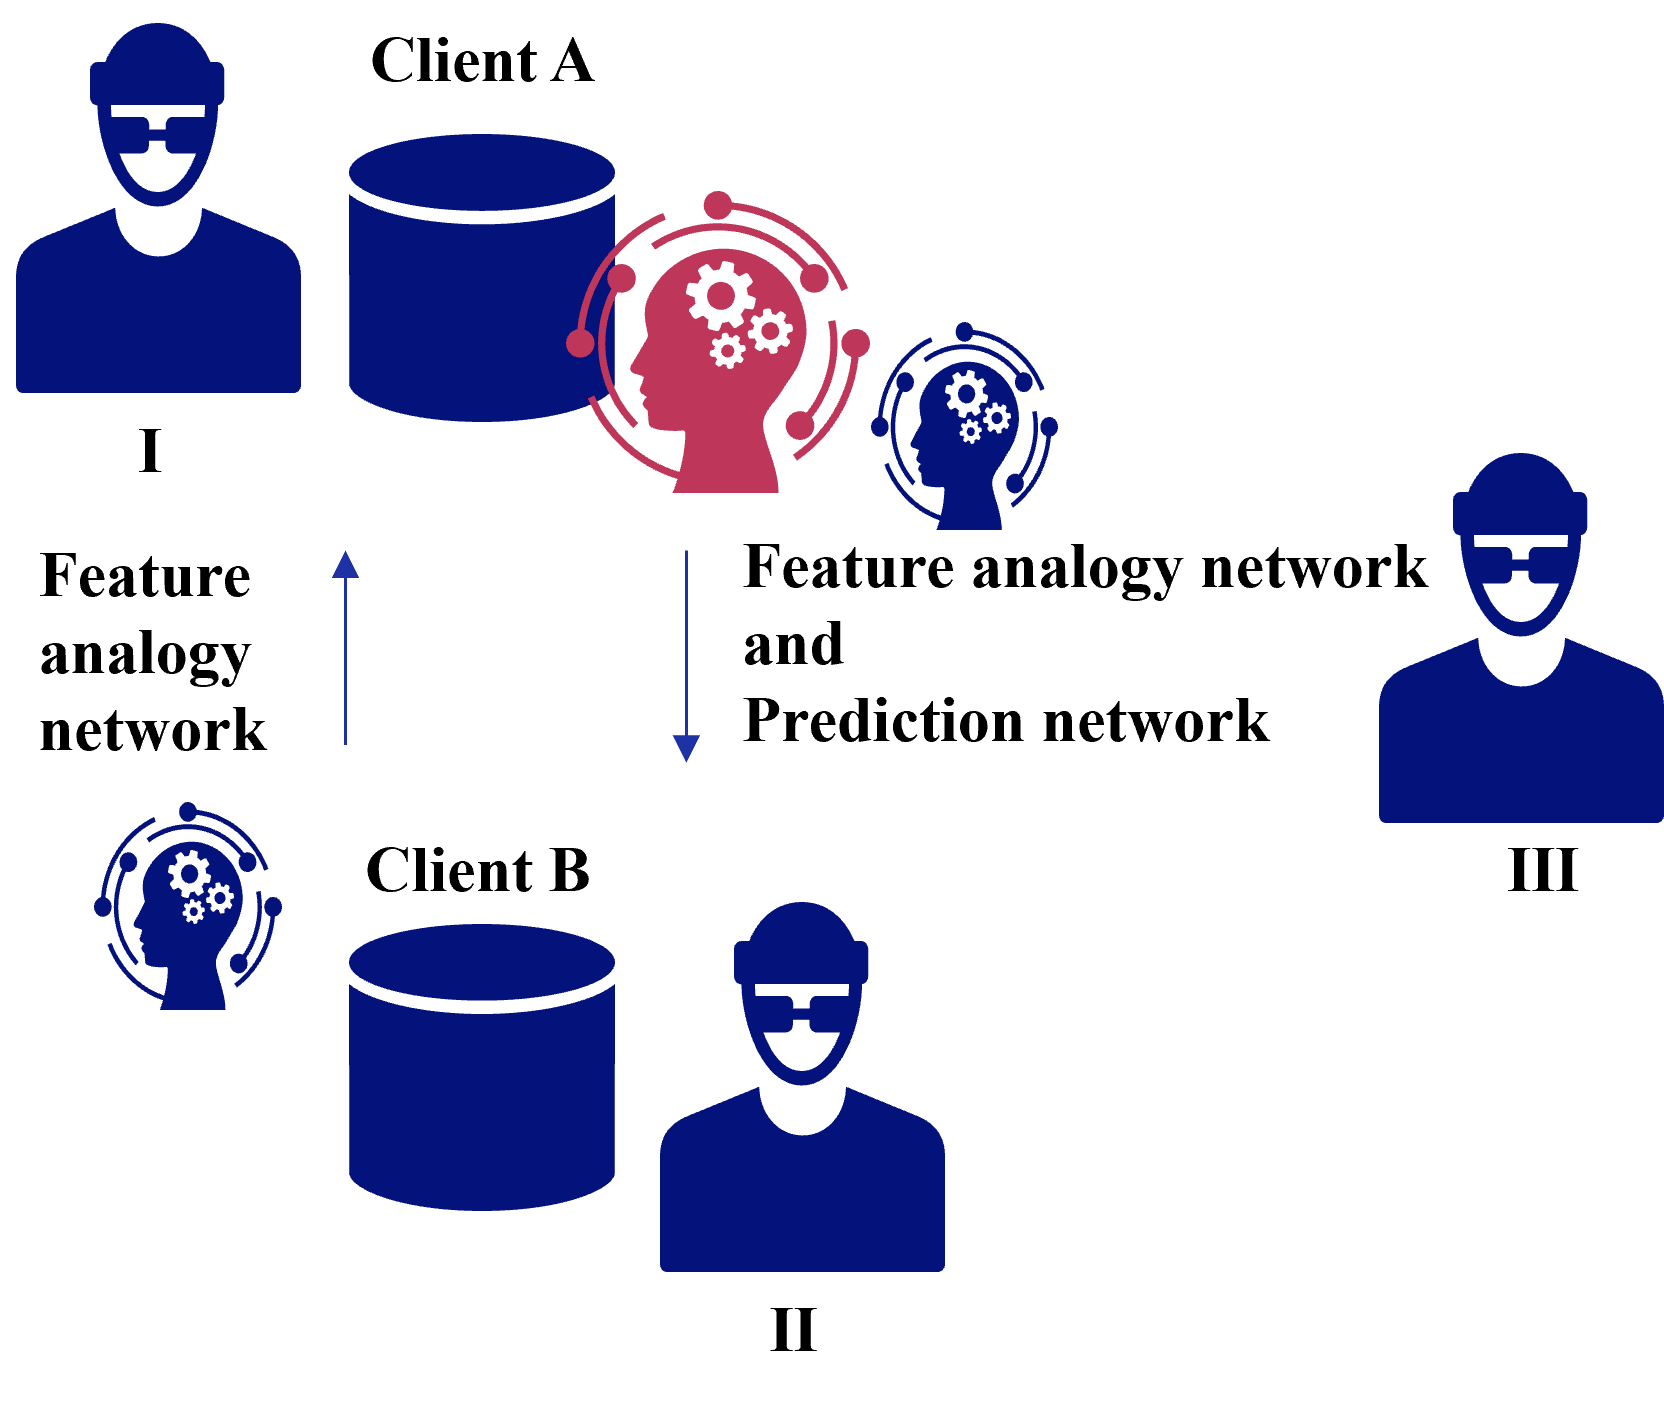
The image is a conceptual system architecture diagram illustrating a federated or collaborative machine learning workflow involving multiple clients and specialized neural networks. The diagram uses icons and text labels to represent entities and data flows, with no numerical data or charts present.
### Components/Axes
The diagram is composed of the following labeled components, arranged spatially on a light gray background:
**Top-Left Region (Section I):**
* **Icon:** A dark blue silhouette of a person wearing glasses, labeled with the Roman numeral **"I"**.
* **Component:** A dark blue cylinder icon labeled **"Client A"**.
* **Network Icon:** A red silhouette of a human head in profile, containing white gears and surrounded by a circular network of red nodes and lines. This is positioned to the right of the Client A database.
**Bottom-Center Region (Section II):**
* **Icon:** A dark blue silhouette of a person wearing glasses, labeled with the Roman numeral **"II"**.
* **Component:** A dark blue cylinder icon labeled **"Client B"**.
* **Network Icon:** A dark blue silhouette of a human head in profile, containing white gears and surrounded by a circular network of blue nodes and lines. This is positioned to the left of the Client B database.
**Right Region (Section III):**
* **Icon:** A dark blue silhouette of a person wearing glasses, labeled with the Roman numeral **"III"**.
* **Network Icon:** A dark blue silhouette of a human head in profile, containing white gears and surrounded by a circular network of blue nodes and lines. This is positioned to the left of the person icon.
**Text Labels and Flow Indicators:**
* **Left Side:** The text **"Feature analogy network"** is placed vertically between the icons for Client B and Client A. A blue arrow points **upward** from the Client B network icon toward the Client A network icon.
* **Center-Right:** The text **"Feature analogy network and Prediction network"** is placed between the red network icon (from Client A) and the network icon for Client III. A blue arrow points **downward** from the red network icon toward the Client III network icon.
### Detailed Analysis
The diagram depicts a structured data flow between three parties (I, II, III) associated with two data-holding clients (A and B).
1. **Data Source & Initial Processing:**
* **Client A (I)** possesses a dataset (cylinder icon). Data from Client A is processed by a **red "Feature analogy network"** (head with gears icon).
* **Client B (II)** possesses a separate dataset. Data from Client B is processed by a **blue "Feature analogy network"**.
2. **Primary Data Flow (Upward):**
* An upward arrow indicates that information from Client B's feature analogy network is sent to Client A's feature analogy network. The label "Feature analogy network" on the left confirms this channel is dedicated to sharing feature-based analogies or representations.
3. **Secondary Data Flow & Prediction (Downward):**
* A downward arrow originates from Client A's red feature analogy network and points toward the network icon associated with **Client III (III)**.
* The label for this flow is **"Feature analogy network and Prediction network"**. This indicates that the output from Client A's network—which likely combines its own features with analogies received from Client B—is used to inform or generate predictions for Client III.
### Key Observations
* **Color Coding:** The network icon for Client A is **red**, while the network icons for Client B and Client III are **blue**. This visually distinguishes the primary processing node (Client A) from the others.
* **Asymmetric Roles:** Client A (I) acts as a central hub, receiving data from Client B and sending processed information to Client III. Client B (II) is a data contributor, and Client III (III) is a data consumer or prediction recipient.
* **Network Types:** The diagram explicitly names two types of neural network components: a **"Feature analogy network"** (present at all three nodes) and a **"Prediction network"** (implied to be part of the processing at Client A or Client III).
* **Spatial Layout:** The legend/labels are integrated directly next to the flow arrows they describe, rather than in a separate legend box. The Roman numerals (I, II, III) clearly label the human stakeholders.
### Interpretation
This diagram illustrates a **privacy-preserving or federated learning framework**. The core concept is that clients (A and B) do not share raw data. Instead, they train local "Feature analogy networks" to extract high-level, abstract features from their private datasets.
Client B shares its learned feature analogies with Client A. Client A then integrates these external analogies with its own features to train a more robust model. The combined knowledge is then used—either directly or via a separate "Prediction network"—to generate insights or predictions for a third party, Client III.
The architecture suggests a scenario where Client A has a central role, perhaps as a model aggregator or service provider, leveraging distributed knowledge from Client B to serve predictions to Client III. The use of "analogy" implies the networks are learning relational or similarity-based representations rather than direct data mappings. The primary goal is collaborative model improvement without exposing sensitive underlying data.