## Diagram: Client Interaction Architecture with Feature and Prediction Networks
### Overview
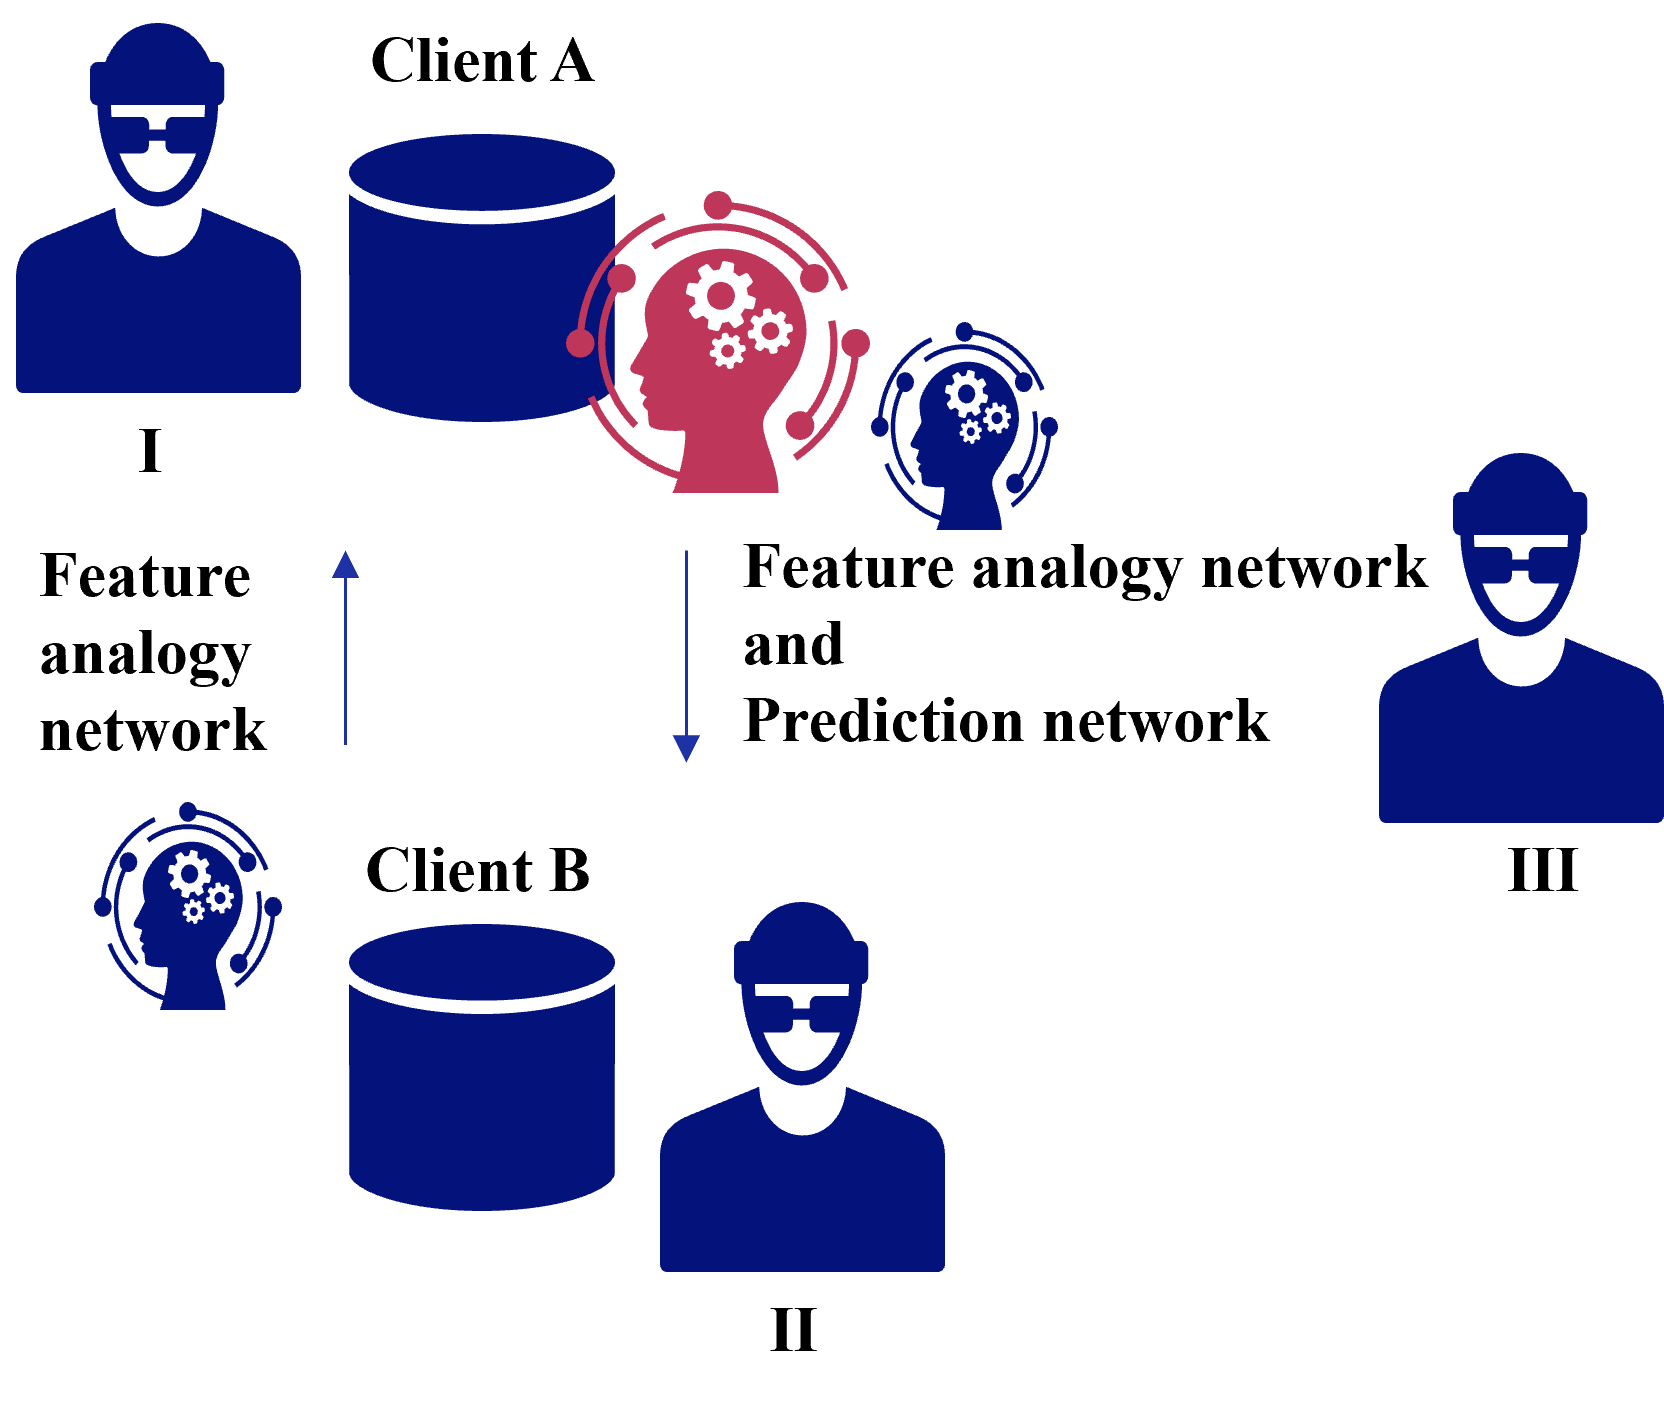
The diagram illustrates a technical architecture involving two clients (Client A and Client B) and a third entity (Client III), connected through two specialized networks: a **Feature Analogy Network** and a **Prediction Network**. Arrows indicate directional data flow, with color-coded components (blue, red, dark blue) representing distinct elements.
---
### Components/Axes
1. **Entities**:
- **Client A** (Top-left): Represented by a blue silhouette with a database (blue cylinder) and a person icon wearing a helmet.
- **Client B** (Bottom-left): Mirroring Client A’s structure but with a red feature analogy network.
- **Client III** (Top-right): A standalone blue silhouette with a helmet, connected to the prediction network.
2. **Networks**:
- **Feature Analogy Network** (Red): Connects Client A’s database to Client B’s database via a bidirectional arrow.
- **Prediction Network** (Dark Blue): Links Client B’s database to Client III via a unidirectional arrow.
3. **Labels**:
- Roman numerals (I, II, III) label the clients.
- Text annotations explicitly name the networks and their functions.
---
### Detailed Analysis
- **Data Flow**:
- **Feature Analogy Network**: Transfers features from Client A’s database to Client B’s database (bidirectional flow).
- **Prediction Network**: Uses Client B’s database to generate predictions for Client III (unidirectional flow).
- **Color Coding**:
- **Blue**: Databases and client silhouettes.
- **Red**: Feature Analogy Network (highlighting its role in feature transfer).
- **Dark Blue**: Prediction Network (emphasizing its predictive function).
- **Structural Relationships**:
- Client A and Client B share a collaborative relationship via the Feature Analogy Network.
- Client III depends on Client B’s processed data through the Prediction Network.
---
### Key Observations
1. **Bidirectional vs. Unidirectional Flow**:
- The Feature Analogy Network allows mutual data exchange between Clients A and B.
- The Prediction Network is strictly one-way, from Client B to Client III.
2. **Color Significance**:
- Red (Feature Analogy Network) and dark blue (Prediction Network) visually distinguish the two core processes.
3. **Client Roles**:
- Client A and B are active participants in feature sharing.
- Client III is a passive recipient of predictions derived from Client B’s data.
---
### Interpretation
This architecture suggests a federated learning or collaborative AI system where:
1. **Feature Analogy** enables knowledge transfer between Clients A and B, likely to improve model generalizability.
2. **Prediction Network** specializes in generating outcomes for Client III using Client B’s data, implying a hierarchical or dependency-based relationship.
3. The use of distinct colors and directional arrows emphasizes modularity and separation of concerns, critical for scalability and security in distributed systems.
No numerical data or trends are present; the diagram focuses on structural and functional relationships.