\n
## 3D Surface Plot: Triangular Surface
### Overview
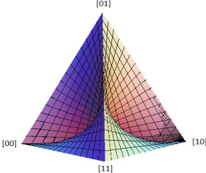
The image depicts a 3D surface plot resembling a cone or a triangular pyramid with a curved surface. The surface is colored with a gradient, transitioning from purple to yellow/orange. The plot is defined by three axes labeled [00], [01], and [11], [10]. The surface appears to be a function of two variables, with the height of the surface changing as you move along the x and y axes.
### Components/Axes
* **Axes:** Three axes are visible, labeled as follows:
* X-axis: [00] to [10]
* Y-axis: [00] to [01]
* Z-axis: Implied vertical axis representing the function's value.
* **Surface:** A curved surface defined by a grid of points.
* **Color Gradient:** The surface is colored with a gradient:
* Purple: Represents lower values of the function.
* Yellow/Orange: Represents higher values of the function.
### Detailed Analysis
The surface rises from a minimum value at approximately [00, 00] and reaches a maximum value along the line connecting [11] and [10]. The surface is symmetrical along the line connecting [00] and [10].
* **[00] to [10] axis:** The surface starts at a low point near [00] and gradually increases in height as it moves towards [10]. The height reaches a maximum around [10].
* **[00] to [01] axis:** The surface starts at a low point near [00] and gradually increases in height as it moves towards [01]. The height reaches a maximum around [01].
* **[11] point:** The surface reaches a peak at the [11] point.
* **Color Distribution:** The purple color dominates the lower left portion of the surface (near [00]), while the yellow/orange color dominates the upper right portion (near [10] and [01]).
It is difficult to extract precise numerical values from the image without a scale on the Z-axis. However, we can observe the relative heights of the surface at different points.
### Key Observations
* The surface is smooth and continuous.
* The surface is symmetrical along the line connecting [00] and [10].
* The maximum value of the function occurs along the line connecting [11] and [10].
* The minimum value of the function occurs near [00].
### Interpretation
The plot likely represents a function of two variables, where the x and y axes represent the input variables and the z-axis represents the output variable. The shape of the surface suggests that the function has a maximum value at [11] and [10] and a minimum value at [00]. The color gradient provides a visual representation of the function's values, with purple representing lower values and yellow/orange representing higher values.
The triangular shape of the plot suggests that the input variables may be constrained to a specific region, such as a triangle. The function may represent a physical quantity, such as energy or probability, that is defined within this region.
Without more information about the function and the axes, it is difficult to provide a more specific interpretation. However, the plot provides a clear visual representation of the function's behavior and its key features. The plot is a visualization of a surface defined by a mathematical function, likely representing a constraint or optimization problem within a triangular domain. The color gradient helps to understand the distribution of values across the surface.