\n
## Visual Reasoning Task Diagram: Task 150deff5
### Overview
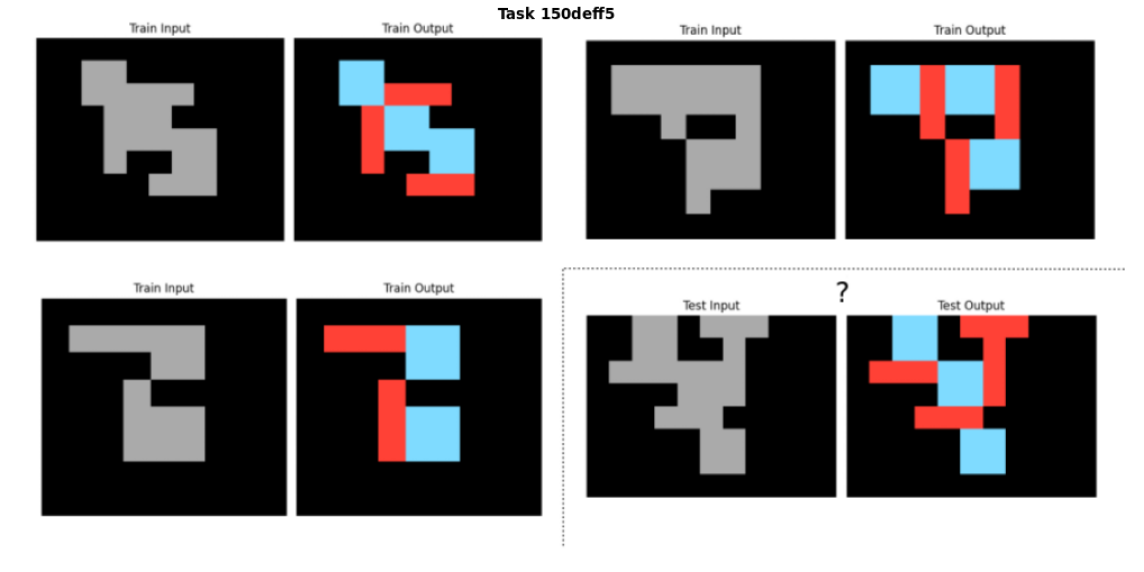
The image displays a visual reasoning puzzle, likely from a dataset such as the Abstraction and Reasoning Corpus (ARC). It presents three training examples (input-output pairs) and one test case. The task is to infer the transformation rule from the training examples and apply it to the test input to generate the correct test output. The overall structure is a 2x2 grid of panels, with the test case separated by a dashed line.
### Components/Axes
* **Header Label:** "Task 150deff5" (centered at the top).
* **Panel Structure:** The image is divided into four main quadrants.
* **Top-Left Quadrant:** Contains the first training example.
* **Top-Right Quadrant:** Contains the second training example.
* **Bottom-Left Quadrant:** Contains the third training example.
* **Bottom-Right Quadrant:** Contains the test case, demarcated by a dashed border.
* **Panel Labels:** Each quadrant contains two sub-panels:
* Left sub-panel: Labeled "Train Input" (or "Test Input" for the test case).
* Right sub-panel: Labeled "Train Output" (or "Test Output" for the test case).
* **Grid Content:** Each sub-panel is a square grid (approx. 10x10 cells) with a black background.
* **Input Panels:** Contain a single, contiguous shape (a polyomino) rendered in solid medium gray.
* **Output Panels:** Contain the *exact same shape* as its corresponding input, but its constituent cells are colored either **red** or **light blue**.
* **Test Output Anomaly:** The "Test Output" panel contains a question mark ("?") in its top-right corner, indicating the solution is unknown and must be deduced.
### Detailed Analysis
**Training Example 1 (Top-Left):**
* **Input Shape:** A blocky, irregular shape resembling a stylized "S" or a Tetris piece. It spans approximately 6 cells wide and 7 cells tall.
* **Output Shape:** The same shape is colored. The coloring pattern appears to partition the shape into two distinct, interlocking regions of red and light blue. No two orthogonally adjacent cells within the shape share the same color.
**Training Example 2 (Top-Right):**
* **Input Shape:** A different, more compact shape with a protruding arm. It spans approximately 5 cells wide and 6 cells tall.
* **Output Shape:** Again, the shape is perfectly 2-colored with red and light blue. The pattern is consistent with a "checkerboard" or bipartite coloring applied only to the cells of the shape.
**Training Example 3 (Bottom-Left):**
* **Input Shape:** A third distinct shape, somewhat resembling a blocky "C" or a hook. It spans approximately 6 cells wide and 5 cells tall.
* **Output Shape:** The shape is 2-colored with red and light blue, following the same rule as the previous examples.
**Test Case (Bottom-Right):**
* **Test Input:** A new, more complex shape. It is larger and has a more intricate outline than the training shapes, spanning approximately 7 cells wide and 8 cells tall.
* **Test Output (Partial):** The output panel shows the test input shape partially colored with red and light blue. The coloring is incomplete, and a question mark is present, signifying that the full, correct coloring must be determined by applying the inferred rule.
### Key Observations
1. **Consistent Transformation:** The core task is consistent across all examples: transform a monochromatic gray shape into a two-colored (red and light blue) version of the same shape.
2. **Coloring Rule:** The output coloring is a **proper 2-coloring** (or bipartite coloring) of the shape's grid cells. This means:
* Every cell within the shape is assigned either red or light blue.
* No two cells that share an edge (orthogonal adjacency) have the same color.
* This is equivalent to coloring the shape like a checkerboard, but only using the cells that form the shape.
3. **Spatial Grounding:** The colors are applied directly to the cells of the shape. There is no rotation, scaling, or movement of the shape between input and output.
4. **Test Case Complexity:** The test input shape is more complex, suggesting the rule must be generalized to any connected polyomino.
### Interpretation
The data demonstrates a classic visual logic puzzle centered on **graph coloring**. The shape can be viewed as a graph where each cell is a node, and edges connect orthogonally adjacent cells. The task is to find a valid 2-coloring of this graph.
* **What the data suggests:** The rule is unambiguous and deterministic. For any given connected shape on a grid, there are exactly two valid 2-colorings (which are color inverses of each other). The training examples show one of these two valid colorings for each shape.
* **How elements relate:** The "Input" defines the structure (the graph). The "Output" is a solution to the coloring problem for that structure. The test case presents a new structure for which the solution must be computed.
* **Notable patterns/anomalies:** There are no outliers in the training data; all examples perfectly follow the 2-coloring rule. The only anomaly is the incomplete test output, which is the puzzle's objective. The presence of the question mark explicitly frames the image as a problem to be solved rather than just a display of information.
* **Underlying Principle:** This task tests the ability to recognize and apply an abstract, mathematical rule (bipartite graph coloring) to visual, spatial data. The solution requires understanding adjacency relationships within the shape and propagating a consistent alternating color pattern throughout its entire connected area.