## Diagram: SwarmSys Collaborative Reasoning Process
### Overview
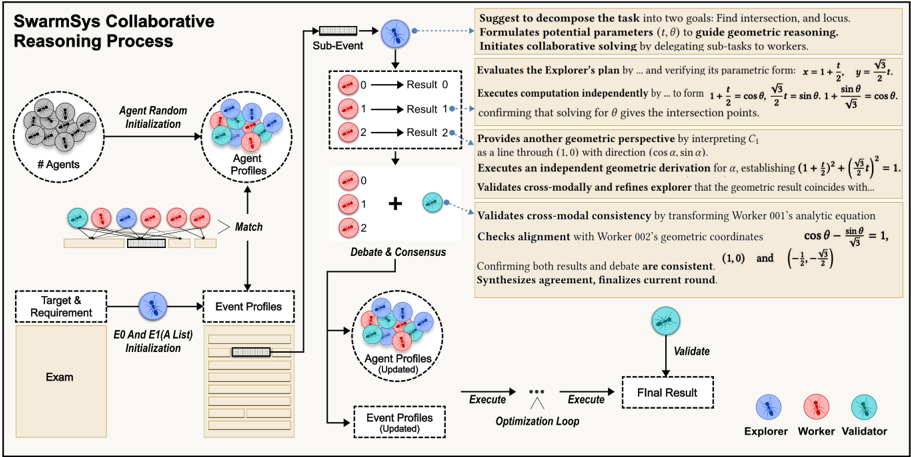
The diagram illustrates a multi-agent collaborative reasoning system (SwarmSys) with interconnected processes for task decomposition, agent coordination, geometric reasoning, and validation. It combines flowcharts, color-coded agent profiles, and technical equations to depict collaborative problem-solving.
### Components/Axes
1. **Left Process Flow**:
- **Agent Initialization**: Circle labeled "# Agents" (top-left) and "Agent Profiles" (color-coded: blue, red, green).
- **Match**: Arrows connecting agent profiles to a "Match" step.
- **Debate & Consensus**: Updated agent profiles after debate.
- **Target & Requirement**: Box labeled "Exam" with "Event Profiles" (E0 and E1 initialization).
2. **Right Flowchart**:
- **Task Decomposition**: Steps to decompose tasks into goals (find intersection/locus).
- **Parameter Formulation**: Equations for geometric reasoning (e.g., `x = 1 + t/2`, `y = √5/2`).
- **Validation Steps**: Cross-modal checks, geometric derivations, and consistency validation.
- **Optimization Loop**: Iterative "Execute" steps leading to "Final Result."
3. **Legend**:
- **Colors**:
- Blue = Explorer
- Red = Worker
- Green = Validator
### Detailed Analysis
- **Agent Initialization**:
- `# Agents` circle (top-left) contains 10 gray dots (agents).
- "Agent Profiles" circle (bottom-left) shows 5 color-coded dots (blue, red, green) representing initialized agents.
- **Matching & Debate**:
- Arrows from "Agent Profiles" to "Match" step.
- "Debate & Consensus" updates agent profiles with new configurations.
- **Geometric Reasoning**:
- Equations for intersection points (e.g., `x = 1 + t/2`, `y = √5/2`).
- Cross-modal validation using Worker 001’s analytic equation and Worker 002’s geometric coordinates.
- **Validation & Final Result**:
- "Validator" (green) checks alignment between analytic and geometric results.
- Final result synthesized after confirming consistency.
### Key Observations
1. **Color-Coded Roles**:
- Explorer (blue), Worker (red), Validator (green) roles are consistently mapped across the diagram.
- Example: In the "Agent Profiles" circle, blue dots align with the Explorer role in the flowchart.
2. **Iterative Process**:
- The "Optimization Loop" (bottom) shows repeated "Execute" steps, emphasizing iterative refinement.
3. **Technical Integration**:
- Geometric reasoning (e.g., `cos θ = sin θ = 1`) is tied to validation steps, ensuring cross-modal consistency.
### Interpretation
The diagram demonstrates a structured collaborative framework where agents (Explorer, Worker, Validator) work together to solve complex tasks. Key elements include:
- **Task Decomposition**: Breaking problems into geometric sub-tasks (e.g., finding intersections).
- **Cross-Modal Validation**: Ensuring consistency between analytic and geometric solutions.
- **Iterative Optimization**: Continuous refinement via the "Execute" loop.
The system prioritizes accuracy through validation steps and leverages geometric reasoning to resolve ambiguities. The color-coded agents and flowchart structure highlight modular collaboration, suggesting scalability for multi-agent systems.