## Scatter Plot & Bar Chart: Sunspot Observations
### Overview
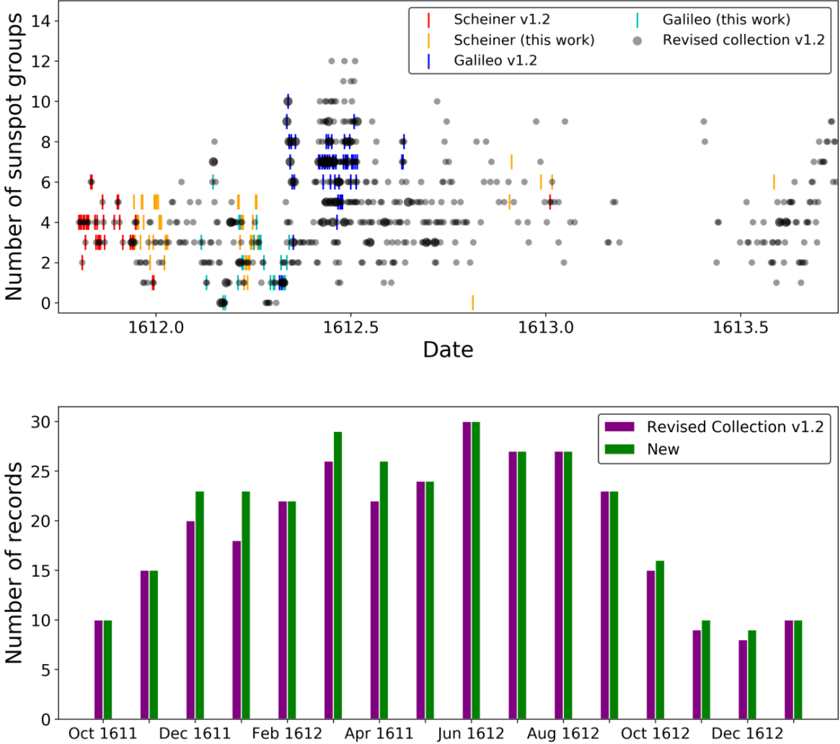
The image contains two charts. The top chart is a scatter plot showing the number of sunspot groups observed over time (from approximately 1612.0 to 1613.5) by different observers (Scheiner and Galileo) and a revised collection. The bottom chart is a bar chart showing the number of records (observations) made in each month from October 1611 to December 1612, categorized as "Revised Collection v1.2" and "New".
### Components/Axes
**Top Chart (Scatter Plot):**
* **X-axis:** Date, ranging from approximately 1612.0 to 1613.5.
* **Y-axis:** Number of sunspot groups, ranging from 0 to 14.
* **Legend (top-right):**
* Scheiner v1.2 (Red)
* Galileo (this work) (Blue)
* Scheiner v1.2 (Orange)
* Galileo v1.2 (Purple)
* Revised collection v1.2 (Black)
**Bottom Chart (Bar Chart):**
* **X-axis:** Months from October 1611 to December 1612.
* **Y-axis:** Number of records, ranging from 0 to 30.
* **Legend (top-right):**
* Revised Collection v1.2 (Grey)
* New (Purple)
### Detailed Analysis or Content Details
**Top Chart (Scatter Plot):**
* **Scheiner v1.2 (Red):** Data points are sparse, mostly between 1 and 5 sunspot groups. There's a cluster around 1612.2 with values between 1 and 3.
* **Galileo (this work) (Blue):** Shows a higher density of data points, with a peak around 1612.2-1612.3, reaching up to approximately 10 sunspot groups. Generally fluctuates between 2 and 8.
* **Scheiner v1.2 (Orange):** Similar to the red data, sparse and mostly between 1 and 4 sunspot groups.
* **Galileo v1.2 (Purple):** Also sparse, with values generally between 1 and 5.
* **Revised collection v1.2 (Black):** The most dense data set, showing a consistent number of sunspot groups between 2 and 8, with peaks around 1612.2-1612.3 reaching up to 10. There's a clear upward trend from 1612.0 to 1612.3, followed by a decline.
**Bottom Chart (Bar Chart):**
* **Revised Collection v1.2 (Grey):** Shows a peak in February 1612 with approximately 28 records. Generally high from February to August 1612, then declines. Values are approximately: Oct 1611 (18), Dec 1611 (22), Feb 1612 (28), Apr 1612 (29), Jun 1612 (24), Aug 1612 (26), Oct 1612 (23), Dec 1612 (10).
* **New (Purple):** Shows a peak in April 1612 with approximately 27 records. Generally lower than the Revised Collection, but follows a similar trend. Values are approximately: Oct 1611 (10), Dec 1611 (14), Feb 1612 (21), Apr 1612 (27), Jun 1612 (16), Aug 1612 (18), Oct 1612 (16), Dec 1612 (8).
### Key Observations
* The scatter plot shows that Galileo generally observed more sunspot groups than Scheiner.
* The "Revised collection v1.2" data in the scatter plot appears to be a combination or smoothing of the individual observations.
* The bar chart indicates a peak in observational activity around April 1612 for both the "Revised Collection" and "New" data.
* The number of records (observations) decreases significantly towards the end of 1612.
* The "Revised Collection" consistently has more records than the "New" data.
### Interpretation
The data suggests a period of increased sunspot activity around 1612, as observed by both Scheiner and Galileo. The differences in their observations could be due to variations in their instruments, observational techniques, or locations. The "Revised collection v1.2" likely represents an attempt to reconcile these different observations and create a more comprehensive dataset.
The bar chart reveals a seasonal pattern in observational activity, with a peak in the spring (around April 1612) and a decline towards the end of the year. This could be related to weather conditions affecting visibility or the availability of time for observations. The higher number of records in the "Revised Collection" suggests that it incorporates data from multiple sources or includes more detailed observations.
The decline in records towards the end of 1612 could indicate a decrease in interest in sunspot observations or a change in priorities for the observers. The data provides valuable insights into the early history of sunspot research and the challenges faced by early astronomers. The combination of the scatter plot and bar chart allows for a nuanced understanding of both the observed sunspot activity and the process of data collection and revision.