## Line Chart: Model Performance on Lichess Puzzle Accuracy
### Overview
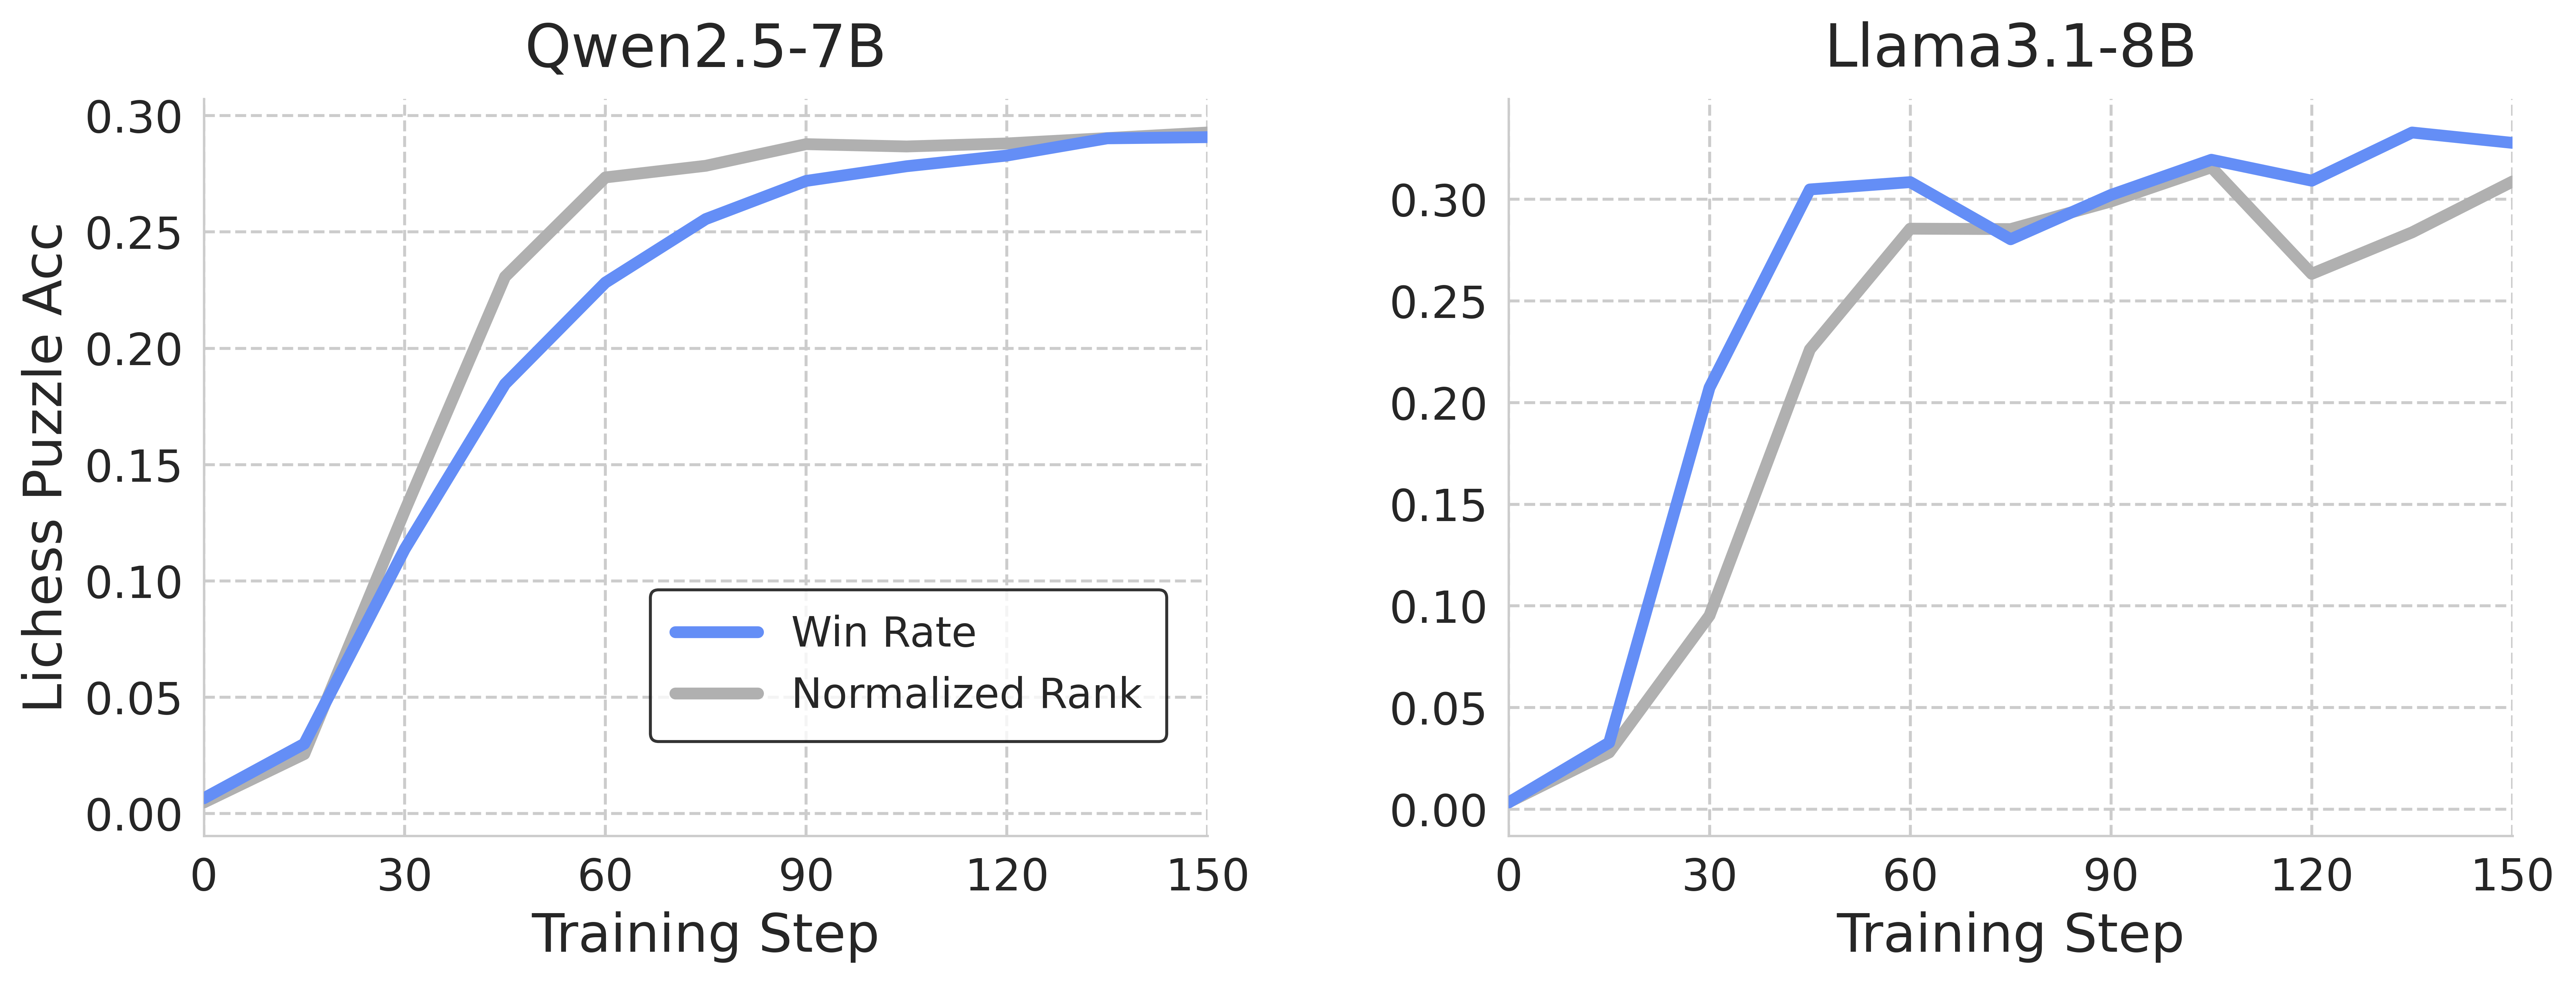
The image presents two line charts comparing the performance of two models, Qwen2.5-7B and Llama3.1-8B, on Lichess puzzles. Both charts plot "Lichess Puzzle Acc" (Accuracy) against "Training Step". Each chart displays two data series: "Win Rate" and "Normalized Rank".
### Components/Axes
* **X-axis:** "Training Step" ranging from 0 to 150. The axis is linearly scaled with markers at intervals of 30.
* **Y-axis:** "Lichess Puzzle Acc" ranging from 0.00 to 0.30. The axis is linearly scaled with markers at intervals of 0.05.
* **Left Chart Title:** "Qwen2.5-7B"
* **Right Chart Title:** "Llama3.1-8B"
* **Legend (Bottom-Left of each chart):**
* "Win Rate" - Represented by a solid blue line.
* "Normalized Rank" - Represented by a solid grey line.
### Detailed Analysis or Content Details
**Qwen2.5-7B Chart:**
* **Win Rate (Blue Line):** The line slopes sharply upward from 0 at Training Step 0, reaching approximately 0.15 at Training Step 30. It continues to rise, leveling off around 0.28-0.29 between Training Steps 90 and 150.
* Step 0: 0.00
* Step 30: ~0.15
* Step 60: ~0.23
* Step 90: ~0.27
* Step 120: ~0.28
* Step 150: ~0.29
* **Normalized Rank (Grey Line):** The line also increases rapidly from 0 at Training Step 0, reaching approximately 0.12 at Training Step 30. It continues to increase, reaching approximately 0.28-0.29 between Training Steps 90 and 150.
* Step 0: 0.00
* Step 30: ~0.12
* Step 60: ~0.21
* Step 90: ~0.27
* Step 120: ~0.28
* Step 150: ~0.29
**Llama3.1-8B Chart:**
* **Win Rate (Blue Line):** The line starts at 0 at Training Step 0 and rises very steeply to approximately 0.28 at Training Step 30. It then fluctuates between approximately 0.26 and 0.31 between Training Steps 60 and 150.
* Step 0: 0.00
* Step 30: ~0.28
* Step 60: ~0.26
* Step 90: ~0.31
* Step 120: ~0.29
* Step 150: ~0.30
* **Normalized Rank (Grey Line):** The line starts at 0 at Training Step 0 and rises steeply to approximately 0.15 at Training Step 30. It then fluctuates between approximately 0.22 and 0.28 between Training Steps 60 and 150.
* Step 0: 0.00
* Step 30: ~0.15
* Step 60: ~0.22
* Step 90: ~0.26
* Step 120: ~0.25
* Step 150: ~0.28
### Key Observations
* Both models show a significant improvement in performance during the initial training steps (0-30).
* Qwen2.5-7B exhibits a smoother learning curve, with a more gradual increase in both Win Rate and Normalized Rank.
* Llama3.1-8B shows a more rapid initial increase, followed by fluctuations in performance.
* The Win Rate consistently outperforms the Normalized Rank for both models.
* Both models appear to converge in performance around Training Step 120-150.
### Interpretation
The data suggests that both Qwen2.5-7B and Llama3.1-8B are effective at learning to solve Lichess puzzles. The initial rapid increase in performance indicates that the models quickly grasp the basic principles of puzzle solving. The subsequent leveling off or fluctuations suggest that the models are approaching their performance limits or are encountering more challenging puzzles.
The difference in learning curves between the two models could be attributed to differences in their architectures, training data, or optimization algorithms. The smoother learning curve of Qwen2.5-7B might indicate a more stable training process, while the fluctuations in Llama3.1-8B could suggest a more sensitive or volatile training process.
The consistently higher Win Rate compared to Normalized Rank suggests that the Win Rate metric is more sensitive to improvements in puzzle-solving ability. The Normalized Rank metric might be influenced by other factors, such as the difficulty of the puzzles or the performance of other players.
The convergence of performance around Training Step 120-150 suggests that both models are reaching a similar level of proficiency in solving Lichess puzzles. Further training might not yield significant improvements in performance.