## Diagram: Mixture of Experts Routing with Temperature Control
### Overview
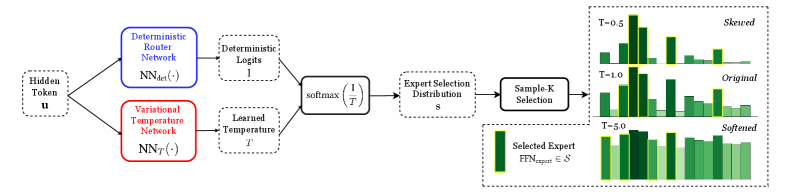
The image depicts a diagram illustrating a Mixture of Experts (MoE) routing mechanism with temperature control. It shows how a hidden token 'u' is processed through deterministic and variational networks, then routed to selected experts based on a softmax function influenced by a learned temperature 'T'. The diagram also visualizes the effect of different temperature values on the expert selection distribution.
### Components/Axes
The diagram consists of the following components:
* **Hidden Token (u):** The input to the system.
* **Deterministic Router Network (NN<sub>det</sub>(-)):** Outputs "Deterministic Logits" labeled as '1'. Colored blue.
* **Variational Network (NN<sub>V</sub>(-)):** Outputs "Learned Temperature" labeled as 'T'. Colored red.
* **Softmax (1/T):** A function that converts logits into a probability distribution.
* **Expert Selection Distribution (S):** The output of the softmax function, representing the probability of selecting each expert.
* **Sample-K Selection:** A process that selects K experts based on the expert selection distribution.
* **Selected Expert FFN<sub>expert</sub> ∈ S:** The selected feed-forward network expert.
* **Visualizations:** Three bar charts illustrating the expert selection distribution for different temperature values: T=0.5 (Skewed), T=1.0 (Original), and T=5.0 (Softened).
### Detailed Analysis or Content Details
The diagram shows a flow of information from left to right.
1. **Input:** A "Hidden Token" labeled 'u' is the starting point.
2. **Parallel Processing:** The hidden token 'u' is fed into two separate networks: a "Deterministic Router Network" (NN<sub>det</sub>(-)) and a "Variational Network" (NN<sub>V</sub>(-)).
3. **Outputs:** The Deterministic Router Network outputs "Deterministic Logits" labeled '1'. The Variational Network outputs a "Learned Temperature" labeled 'T'.
4. **Softmax:** The Deterministic Logits and Learned Temperature are combined in a softmax function (1/T) to produce an "Expert Selection Distribution" labeled 'S'.
5. **Expert Selection:** The "Expert Selection Distribution" 'S' is used in a "Sample-K Selection" process to choose a subset of experts.
6. **Selected Expert:** The selected experts are represented as "Selected Expert FFN<sub>expert</sub> ∈ S".
7. **Visualizations of Expert Selection:** Three bar charts demonstrate the effect of the temperature 'T' on the expert selection distribution.
* **T=0.5 (Skewed):** The distribution is highly skewed, with one expert having a significantly higher probability than others. The height of the bars varies significantly, ranging from approximately 20% to 80% (estimated).
* **T=1.0 (Original):** The distribution is more uniform than T=0.5, but still shows some variation. Bar heights range from approximately 10% to 40% (estimated).
* **T=5.0 (Softened):** The distribution is nearly uniform, with all experts having roughly equal probabilities. Bar heights are approximately 10-20% (estimated).
### Key Observations
* The temperature 'T' controls the sharpness of the expert selection distribution.
* Lower temperatures (T=0.5) lead to a more skewed distribution, favoring a small number of experts.
* Higher temperatures (T=5.0) lead to a more uniform distribution, utilizing a wider range of experts.
* The diagram illustrates a mechanism for dynamically adjusting the expert selection process based on a learned temperature parameter.
### Interpretation
This diagram demonstrates a sophisticated routing mechanism for Mixture of Experts models. The key innovation is the use of a learned temperature parameter 'T' to control the diversity of expert selection. By adjusting 'T', the model can dynamically switch between focusing on a few highly specialized experts (low T) and leveraging a broader range of experts (high T). This allows the model to adapt to different input characteristics and potentially improve generalization performance. The visualizations clearly show how the temperature parameter influences the expert selection distribution, providing a visual intuition for the mechanism's behavior. The use of both deterministic and variational networks suggests a balance between exploitation (deterministic routing) and exploration (variational routing). The notation FFN<sub>expert</sub> ∈ S indicates that the selected experts are feed-forward networks belonging to the set of all available experts 'S'.