## Line Charts: Loss and Average Reward
### Overview
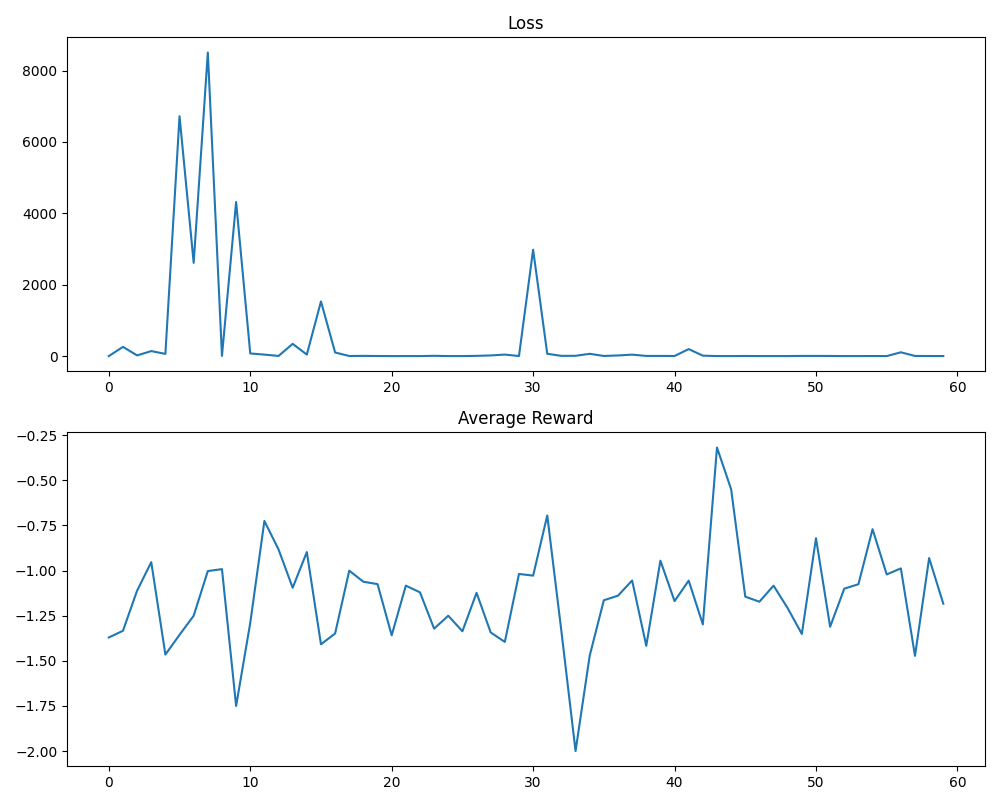
The image displays two vertically stacked line charts representing performance metrics over a training period of 60 steps (x-axis). The top chart tracks "Loss," while the bottom chart tracks "Average Reward." These charts are characteristic of monitoring logs for a machine learning model, likely a Reinforcement Learning (RL) agent.
### Components/Axes
* **Shared X-Axis:** Represents training steps or epochs, ranging from 0 to 60.
* **Top Chart (Loss):**
* **Title:** "Loss"
* **Y-Axis:** Represents the loss value, ranging from 0 to over 8000.
* **Bottom Chart (Average Reward):**
* **Title:** "Average Reward"
* **Y-Axis:** Represents the average reward value, ranging from -2.00 to -0.25.
### Detailed Analysis
#### Top Chart: Loss
* **Trend:** The line is characterized by extreme volatility in the early stages (steps 0–15), followed by a period of relative stability near zero, interrupted by a single significant spike at step 30.
* **Data Points (Approximate):**
* **Steps 0–4:** The loss is low, hovering near 0.
* **Step 5:** A sharp upward spike to approximately 6,700.
* **Step 7:** The global maximum, reaching approximately 8,500.
* **Step 9:** A secondary spike to approximately 4,300.
* **Step 15:** A smaller spike to approximately 1,500.
* **Step 30:** A distinct, isolated spike to approximately 3,000.
* **Steps 31–60:** The loss remains consistently near 0, with minor fluctuations.
#### Bottom Chart: Average Reward
* **Trend:** The line exhibits high-frequency oscillation throughout the entire 60-step duration. There is no discernible upward trend, indicating the agent is not consistently improving its performance.
* **Data Points (Approximate):**
* **Start (Step 0):** Approximately -1.35.
* **Step 9:** A local minimum of approximately -1.75.
* **Step 33:** The global minimum of approximately -2.00.
* **Step 43:** The global maximum (best performance) of approximately -0.30.
* **General Range:** The majority of the data points fluctuate between -1.5 and -0.75.
### Key Observations
* **Initial Instability:** The "Loss" chart shows massive instability in the first 10 steps, suggesting the model may have had a high learning rate or encountered difficult initial states.
* **Lack of Convergence:** The "Average Reward" chart does not show a clear trend toward a higher (less negative) value. The agent appears to be exploring or failing to learn a stable policy, as the reward remains highly volatile.
* **Anomalous Spike:** The spike in "Loss" at step 30 does not appear to have a corresponding, immediate, or obvious impact on the "Average Reward" at that exact step, suggesting a potential decoupling between the loss function and the actual performance metric in this specific training run.
### Interpretation
This data suggests a **failed or struggling training process**.
In a successful Reinforcement Learning scenario, one would expect the "Loss" to decrease and stabilize, and the "Average Reward" to trend upward over time. Here, the "Average Reward" remains trapped in a noisy, oscillating state between -2.0 and -0.3, indicating the agent has not learned an optimal policy. The extreme spikes in "Loss" early on suggest the model was likely struggling to optimize its parameters, possibly due to an unstable environment, an inappropriate learning rate, or a poorly defined reward function. The lack of correlation between the loss spikes and reward fluctuations further implies that the loss function being minimized may not be effectively guiding the agent toward higher rewards.