## Line Graphs: Model Accuracy vs. τ_max (AIME24 and GPQA-D)
### Overview
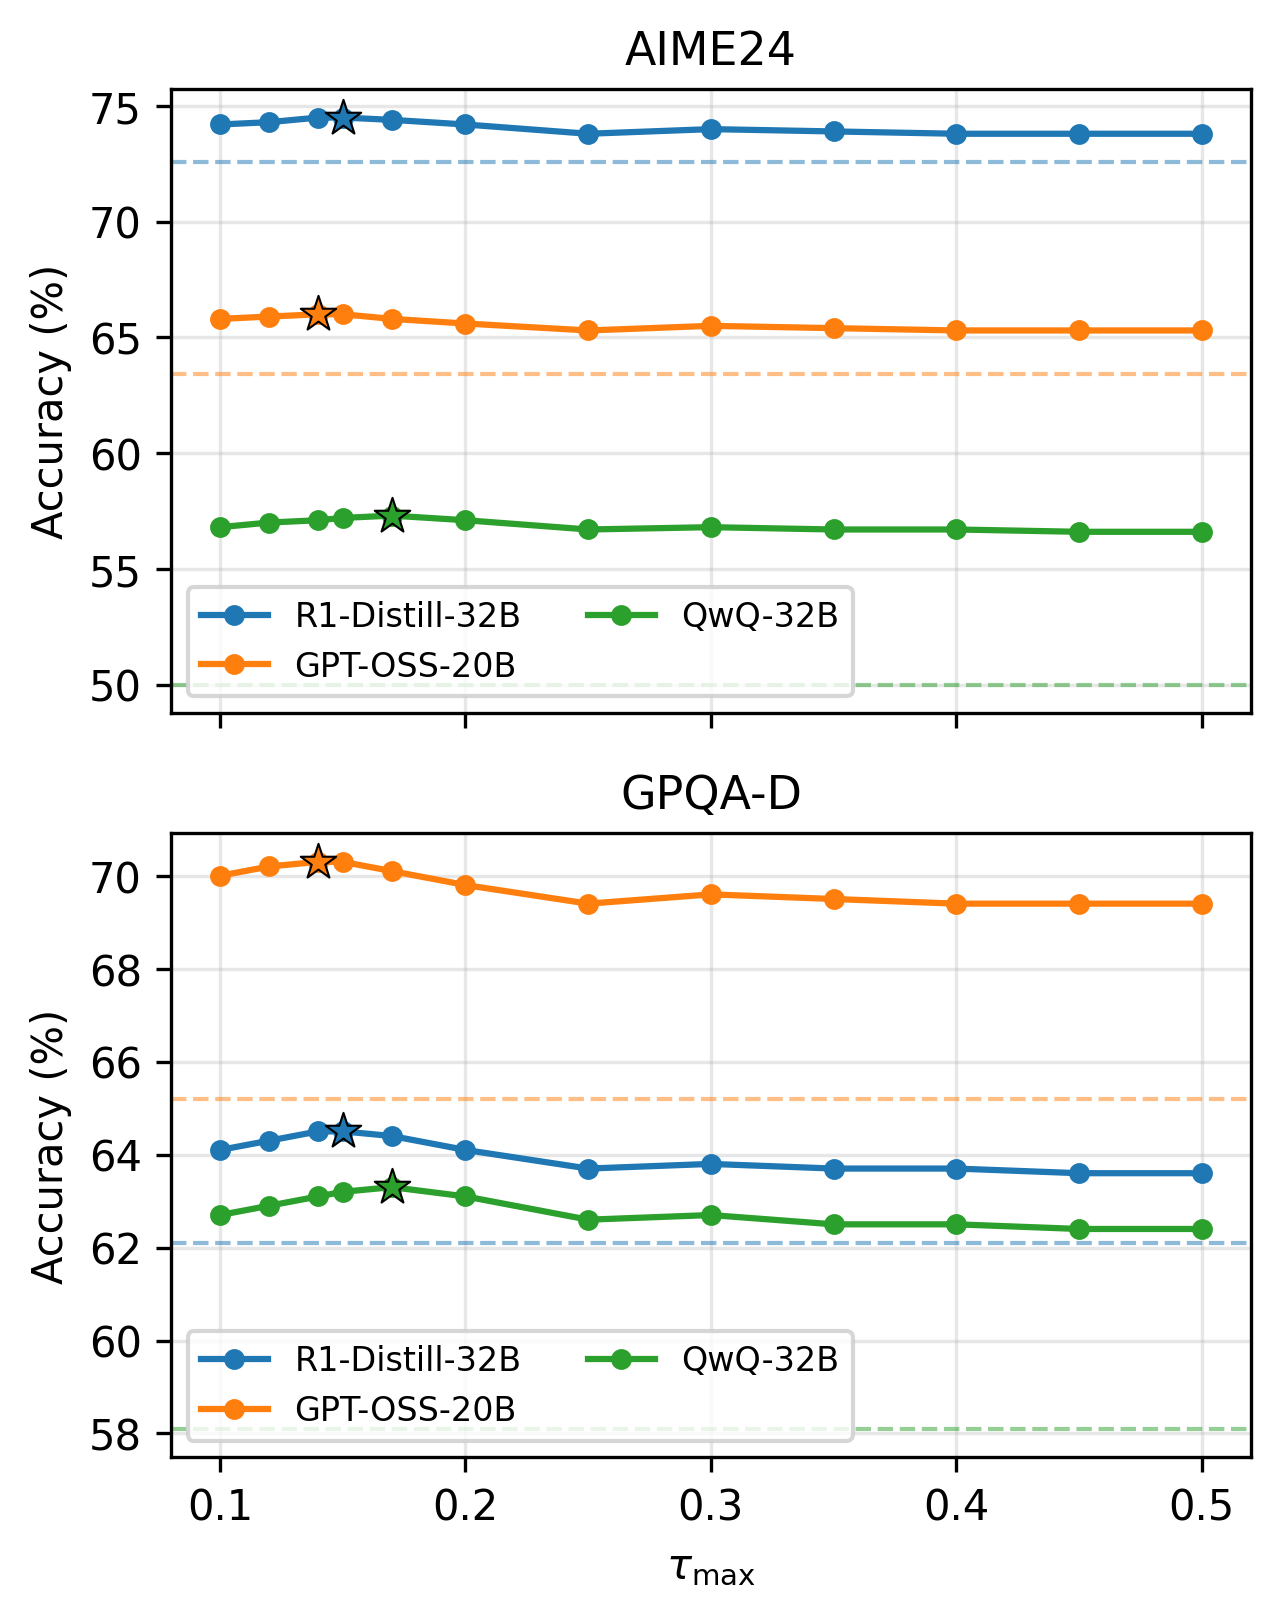
The image contains two line graphs comparing the accuracy of three AI models (R1-Distill-32B, GPT-OSS-20B, QwQ-32B) across two datasets (AIME24 and GPQA-D) as a function of τ_max (0.1 to 0.5). Accuracy is measured in percentage, with dashed horizontal lines indicating baseline performance thresholds.
---
### Components/Axes
1. **X-Axis (τ_max)**:
- Range: 0.1 to 0.5 (increments of 0.1)
- Label: "τ_max" (Greek letter tau)
2. **Y-Axis (Accuracy %)**:
- AIME24: 50–75% (increments of 5%)
- GPQA-D: 58–70% (increments of 2%)
3. **Legends**:
- Positioned at bottom-left of each graph
- Colors:
- Blue: R1-Distill-32B
- Orange: GPT-OSS-20B
- Green: QwQ-32B
4. **Data Points**:
- Marked with circular symbols
- Stars (*) highlight specific τ_max values (0.2 for AIME24, 0.1 for GPQA-D)
---
### Detailed Analysis
#### AIME24 Graph
- **R1-Distill-32B (Blue)**:
- Starts at 74.5% (τ_max=0.1), peaks at 74.8% (τ_max=0.2), then declines to 74.3% (τ_max=0.5).
- Star at τ_max=0.2 (74.8%).
- **GPT-OSS-20B (Orange)**:
- Starts at 65.8% (τ_max=0.1), drops to 65.5% (τ_max=0.5).
- Star at τ_max=0.2 (66.1%).
- **QwQ-32B (Green)**:
- Starts at 57.2% (τ_max=0.1), declines to 57.0% (τ_max=0.5).
- Star at τ_max=0.2 (57.5%).
#### GPQA-D Graph
- **R1-Distill-32B (Blue)**:
- Starts at 64.2% (τ_max=0.1), peaks at 64.7% (τ_max=0.2), then declines to 63.8% (τ_max=0.5).
- Star at τ_max=0.1 (64.2%).
- **GPT-OSS-20B (Orange)**:
- Starts at 70.1% (τ_max=0.1), drops to 69.5% (τ_max=0.5).
- Star at τ_max=0.1 (70.1%).
- **QwQ-32B (Green)**:
- Starts at 62.8% (τ_max=0.1), declines to 62.5% (τ_max=0.5).
- Star at τ_max=0.2 (63.1%).
---
### Key Observations
1. **Trends**:
- All models show slight accuracy declines as τ_max increases, except for R1-Distill-32B in AIME24 (peak at τ_max=0.2).
- GPT-OSS-20B consistently outperforms other models in both datasets.
- QwQ-32B has the lowest accuracy across all τ_max values.
2. **Outliers**:
- R1-Distill-32B in AIME24 achieves its highest accuracy at τ_max=0.2 (74.8%).
- GPT-OSS-20B in GPQA-D maintains near-constant accuracy (70.1% → 69.5%).
---
### Interpretation
1. **Model Performance**:
- R1-Distill-32B demonstrates robustness, maintaining high accuracy across τ_max values, with a notable peak in AIME24.
- GPT-OSS-20B exhibits the highest baseline accuracy but shows sensitivity to τ_max changes in GPQA-D.
- QwQ-32B underperforms relative to other models, suggesting potential limitations in architecture or training.
2. **τ_max Impact**:
- Minimal accuracy variation across τ_max values implies that τ_max has a negligible effect on performance for these models.
- Exceptions (e.g., R1-Distill-32B in AIME24) suggest context-dependent optimization opportunities.
3. **Dataset Differences**:
- AIME24 has a higher baseline accuracy range (50–75%) compared to GPQA-D (58–70%), indicating differing task complexities.
---
### Spatial Grounding
- Legends are consistently placed at the bottom-left of each graph.
- Data points are evenly spaced along the τ_max axis, with stars positioned at specific τ_max values (0.1–0.2).
### Content Details
- **AIME24 Baseline**: 72% (dashed blue line).
- **GPQA-D Baseline**: 66% (dashed orange line).
- **QwQ-32B Baseline**: 58% (dashed green line).
---
### Final Notes
The graphs highlight trade-offs between model complexity (parameter count) and performance. R1-Distill-32B balances efficiency and accuracy, while GPT-OSS-20B prioritizes raw performance at the cost of scalability. QwQ-32B’s lower accuracy may reflect architectural trade-offs for speed or resource efficiency.