## Bar Chart: Accuracy Test on 4 Queries
### Overview
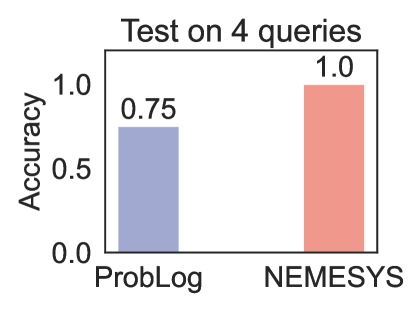
The image is a bar chart comparing the accuracy of two systems, ProbLog and NEMESYS, based on a test of 4 queries. The y-axis represents accuracy, ranging from 0.0 to 1.0. The x-axis represents the two systems being compared.
### Components/Axes
* **Title:** Test on 4 queries
* **X-axis:**
* Labels: ProbLog, NEMESYS
* **Y-axis:**
* Label: Accuracy
* Scale: 0.0, 0.5, 1.0
* **Bars:**
* ProbLog: Light blue/purple color
* NEMESYS: Light red/orange color
### Detailed Analysis
* **ProbLog:** The light blue/purple bar reaches an accuracy of approximately 0.75.
* **NEMESYS:** The light red/orange bar reaches an accuracy of 1.0.
### Key Observations
* NEMESYS achieves a higher accuracy (1.0) compared to ProbLog (0.75) on the test of 4 queries.
### Interpretation
The bar chart indicates that NEMESYS outperforms ProbLog in terms of accuracy when tested on the given 4 queries. NEMESYS achieves perfect accuracy, while ProbLog's accuracy is at 75%. This suggests that, for these specific queries, NEMESYS is a more reliable system. The limited number of queries (4) should be considered when generalizing these results.