## Bar Chart: Test on 4 queries
### Overview
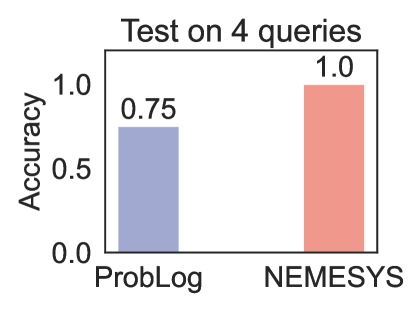
The image is a vertical bar chart comparing the accuracy of two systems, ProbLog and NEMESYS, on a test consisting of 4 queries. The chart clearly shows a performance difference between the two systems.
### Components/Axes
* **Chart Title:** "Test on 4 queries" (centered at the top).
* **Y-Axis:**
* **Label:** "Accuracy" (rotated vertically on the left side).
* **Scale:** Linear scale from 0.0 to 1.0.
* **Major Tick Marks:** 0.0, 0.5, 1.0.
* **X-Axis:**
* **Categories:** Two categories are labeled below their respective bars: "ProbLog" (left) and "NEMESYS" (right).
* **Data Series (Bars):**
* **ProbLog Bar:** A blue bar positioned on the left side of the chart. The numerical value `0.75` is displayed directly above it.
* **NEMESYS Bar:** A red/salmon-colored bar positioned on the right side of the chart. The numerical value `1.0` is displayed directly above it.
* **Legend:** Not present as a separate element. The categories are identified by the x-axis labels directly beneath each bar.
### Detailed Analysis
* **ProbLog:** The blue bar reaches a height corresponding to an accuracy value of **0.75** (or 75%).
* **NEMESYS:** The red bar reaches the maximum height of the y-axis, corresponding to an accuracy value of **1.0** (or 100%).
* **Visual Trend:** The NEMESYS bar is visibly taller than the ProbLog bar, indicating a higher accuracy score.
### Key Observations
1. **Perfect Score:** NEMESYS achieved a perfect accuracy score of 1.0 on the test.
2. **Performance Gap:** There is a significant 0.25 (25 percentage point) difference in accuracy between NEMESYS (1.0) and ProbLog (0.75).
3. **Test Scope:** The evaluation was conducted on a small set of 4 queries, as stated in the title.
### Interpretation
The data demonstrates that for this specific test set of 4 queries, the NEMESYS system performed flawlessly, while the ProbLog system made errors, achieving 75% accuracy. This suggests that NEMESYS may be more effective or better suited for the type of reasoning or problem-solving required by these particular queries. The chart serves as a direct, visual comparison highlighting NEMESYS's superior performance in this limited evaluation. The small number of queries (4) should be noted, as it may not be representative of performance on a larger, more diverse dataset.