## Charts: Accuracy (ACC) and Expected Calibration Error (ECE) vs. Layer Index
### Overview
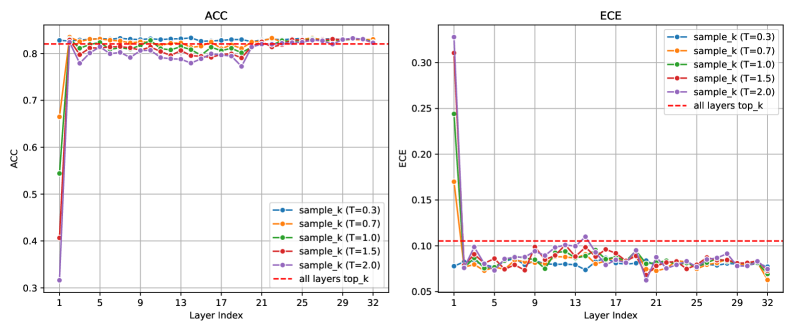
The image presents two line charts side-by-side. The left chart displays Accuracy (ACC) against Layer Index, while the right chart shows Expected Calibration Error (ECE) against Layer Index. Both charts compare the performance of different sampling methods (identified by temperature 'T' values) and an 'all layers top_k' method.
### Components/Axes
**Left Chart (ACC):**
* **Title:** ACC
* **X-axis:** Layer Index (ranging from approximately 0 to 32, with markers at 1, 5, 9, 13, 17, 21, 25, 29, and 32)
* **Y-axis:** ACC (ranging from approximately 0.3 to 0.9, with markers at 0.3, 0.4, 0.5, 0.6, 0.7, 0.8, and 0.9)
* **Legend (bottom-right):**
* `sample_k (T=0.3)` - Blue dashed line
* `sample_k (T=0.7)` - Orange dashed line
* `sample_k (T=1.0)` - Green solid line
* `sample_k (T=1.5)` - Purple dashed line
* `sample_k (T=2.0)` - Gray dashed line
* `all layers top_k` - Red solid line
**Right Chart (ECE):**
* **Title:** ECE
* **X-axis:** Layer Index (ranging from approximately 0 to 32, with markers at 1, 5, 9, 13, 17, 21, 25, 29, and 32)
* **Y-axis:** ECE (ranging from approximately 0.05 to 0.35, with markers at 0.05, 0.10, 0.15, 0.20, 0.25, 0.30, and 0.35)
* **Legend (bottom-right):**
* `sample_k (T=0.3)` - Blue dashed line
* `sample_k (T=0.7)` - Orange dashed line
* `sample_k (T=1.0)` - Green solid line
* `sample_k (T=1.5)` - Purple dashed line
* `sample_k (T=2.0)` - Gray dashed line
* `all layers top_k` - Red solid line
### Detailed Analysis or Content Details
**Left Chart (ACC):**
* `sample_k (T=0.3)`: Starts at approximately 0.35, rapidly increases to around 0.82 by Layer Index 5, then fluctuates between 0.78 and 0.83.
* `sample_k (T=0.7)`: Starts at approximately 0.35, increases to around 0.81 by Layer Index 5, then fluctuates between 0.78 and 0.83.
* `sample_k (T=1.0)`: Starts at approximately 0.35, increases to around 0.80 by Layer Index 5, then fluctuates between 0.78 and 0.83.
* `sample_k (T=1.5)`: Starts at approximately 0.35, increases to around 0.79 by Layer Index 5, then fluctuates between 0.77 and 0.82.
* `sample_k (T=2.0)`: Starts at approximately 0.35, increases to around 0.78 by Layer Index 5, then fluctuates between 0.76 and 0.81.
* `all layers top_k`: Starts at approximately 0.35, rapidly increases to around 0.84 by Layer Index 1, then remains relatively stable around 0.82-0.84.
**Right Chart (ECE):**
* `sample_k (T=0.3)`: Starts at approximately 0.32, drops sharply to around 0.07 by Layer Index 5, then fluctuates between 0.06 and 0.09.
* `sample_k (T=0.7)`: Starts at approximately 0.32, drops sharply to around 0.07 by Layer Index 5, then fluctuates between 0.06 and 0.09.
* `sample_k (T=1.0)`: Starts at approximately 0.32, drops sharply to around 0.07 by Layer Index 5, then fluctuates between 0.06 and 0.09.
* `sample_k (T=1.5)`: Starts at approximately 0.32, drops sharply to around 0.08 by Layer Index 5, then fluctuates between 0.07 and 0.10.
* `sample_k (T=2.0)`: Starts at approximately 0.32, drops sharply to around 0.08 by Layer Index 5, then fluctuates between 0.07 and 0.10.
* `all layers top_k`: Starts at approximately 0.32, drops sharply to around 0.10 by Layer Index 5, then remains relatively stable around 0.08-0.11.
### Key Observations
* All sampling methods show a rapid increase in accuracy within the first few layers (up to Layer Index 5).
* The 'all layers top_k' method achieves the highest accuracy and maintains a relatively stable performance across all layers.
* ECE generally decreases rapidly in the initial layers for all methods, then plateaus.
* The 'all layers top_k' method has a higher ECE than the sampling methods after the initial drop.
* The sampling methods with lower temperatures (T=0.3, T=0.7, T=1.0) exhibit very similar performance in both ACC and ECE.
### Interpretation
The charts demonstrate the trade-off between accuracy and calibration. The 'all layers top_k' method achieves the highest accuracy but suffers from higher expected calibration error, indicating that its confidence scores are less reliable. The sampling methods, particularly those with lower temperatures, offer a better balance between accuracy and calibration. The initial rapid increase in accuracy suggests that the model learns quickly in the early layers. The plateauing of ECE indicates that the model's confidence scores become more stable as the layers deepen. The consistent performance of the sampling methods with lower temperatures suggests that these settings provide a more robust and reliable approach to model calibration. The sharp drop in ECE at the beginning of training suggests that the initial layers are crucial for establishing well-calibrated confidence scores.