## Scatter Plot: Test Accuracy vs. Compression Rate
### Overview
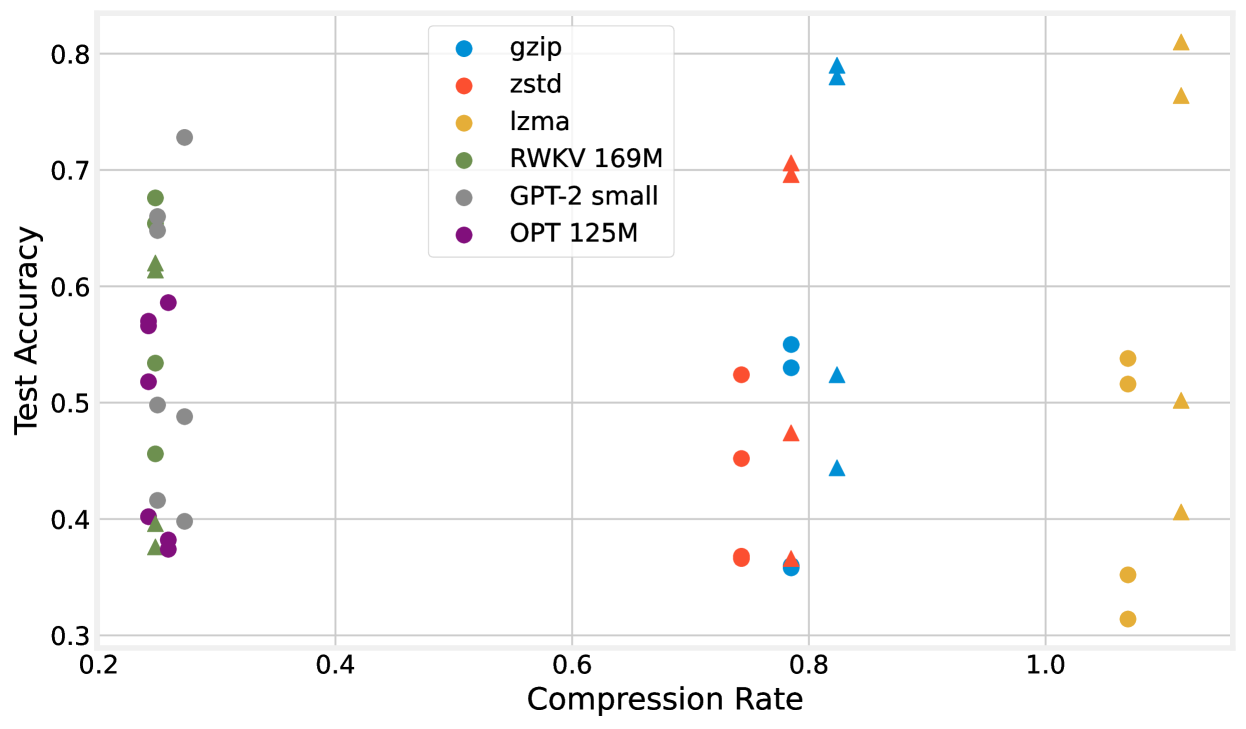
The image is a scatter plot comparing test accuracy (y-axis) against compression rate (x-axis) for six different compression models. Data points are color-coded by model, with a legend in the top-left corner. The plot reveals trade-offs between compression efficiency and performance accuracy across models.
### Components/Axes
- **X-axis (Compression Rate)**: Ranges from 0.2 to 1.2 in increments of 0.1.
- **Y-axis (Test Accuracy)**: Ranges from 0.3 to 0.8 in increments of 0.1.
- **Legend**: Located in the top-left corner, mapping colors to models:
- Blue circles: gzip
- Orange circles: zstd
- Yellow circles: lzma
- Green circles: RWKV 169M
- Gray circles: GPT-2 small
- Purple circles: OPT 125M
### Detailed Analysis
1. **gzip (Blue Circles)**:
- Test accuracy decreases from ~0.75 at 0.2 compression to ~0.55 at 0.8 compression.
- No data points beyond 0.8 compression.
2. **zstd (Orange Circles)**:
- Accuracy declines from ~0.65 at 0.2 compression to ~0.45 at 0.8 compression.
- No data points beyond 0.8 compression.
3. **lzma (Yellow Circles)**:
- Accuracy drops sharply from ~0.6 at 0.2 compression to ~0.3 at 1.2 compression.
- Highest compression rate (1.2) but lowest accuracy.
4. **RWKV 169M (Green Circles)**:
- Relatively stable accuracy (~0.55–0.65) across 0.2–0.6 compression.
- Slight decline to ~0.5 at 0.8 compression.
5. **GPT-2 small (Gray Circles)**:
- Accuracy fluctuates between ~0.4 and ~0.7 across 0.2–0.6 compression.
- No data points beyond 0.6 compression.
6. **OPT 125M (Purple Circles)**:
- Accuracy ranges from ~0.38 to ~0.6 across 0.2–0.6 compression.
- No data points beyond 0.6 compression.
### Key Observations
- **Trade-off Pattern**: Higher compression rates generally correlate with lower test accuracy for most models.
- **Outliers**:
- Lzma achieves the highest compression rate (1.2) but has the lowest accuracy (~0.3).
- RWKV 169M maintains higher accuracy than other models at lower compression rates.
- **Trends**:
- gzip and zstd show consistent declines in accuracy with increasing compression.
- RWKV 169M exhibits the most stable performance across compression rates.
### Interpretation
The data suggests a fundamental trade-off between compression efficiency and model performance. Models like RWKV 169M appear to balance these factors better, maintaining higher accuracy even at moderate compression rates. In contrast, lzma and gzip prioritize compression at the expense of accuracy, which may be unsuitable for applications requiring high fidelity. The absence of data beyond 0.6 compression for some models (e.g., GPT-2 small, OPT 125M) implies potential limitations in their compression capabilities or testing scope. This visualization highlights the need for context-specific model selection based on the priority between compression and accuracy.