## Chart Type: Line Graphs Comparing Attention Weights
### Overview
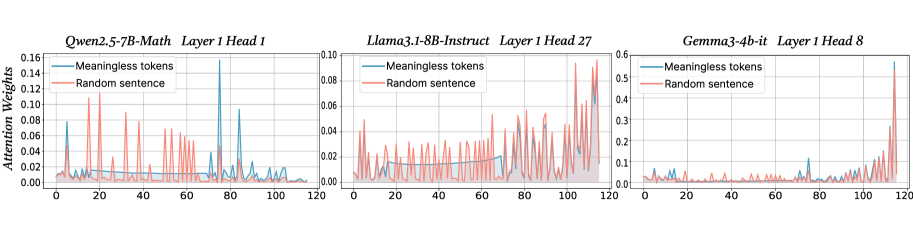
The image presents three line graphs, each comparing the attention weights of "Meaningless tokens" and a "Random sentence" across a sequence of 120 steps. The graphs are titled according to the model, layer, and head being analyzed: "Qwen2.5-7B-Math Layer 1 Head 1", "Llama3.1-8B-Instruct Layer 1 Head 27", and "Gemma3-4b-it Layer 1 Head 8". The y-axis represents "Attention Weights", and the x-axis represents the sequence steps, ranging from 0 to 120.
### Components/Axes
* **Titles (Top of each chart):**
* Left: "Qwen2.5-7B-Math Layer 1 Head 1"
* Center: "Llama3.1-8B-Instruct Layer 1 Head 27"
* Right: "Gemma3-4b-it Layer 1 Head 8"
* **Y-axis Label:** "Attention Weights"
* **X-axis:** Sequence steps, ranging from 0 to 120 in all three graphs.
* **Y-axis Scale:**
* Left: 0.00 to 0.16, incrementing by 0.02.
* Center: 0.00 to 0.10, incrementing by 0.02.
* Right: 0.0 to 0.6, incrementing by 0.1.
* **Legend (Top-Left of each chart):**
* Blue line: "Meaningless tokens"
* Red line: "Random sentence"
### Detailed Analysis
**Left Chart: Qwen2.5-7B-Math Layer 1 Head 1**
* **Meaningless tokens (Blue):** The attention weights are generally low, mostly below 0.02, with occasional spikes. There are notable spikes around steps 20, 40, 80, and 115, reaching values around 0.10 to 0.16.
* **Random sentence (Red):** The attention weights fluctuate significantly, with numerous sharp spikes throughout the sequence. Many spikes reach values between 0.04 and 0.12.
**Center Chart: Llama3.1-8B-Instruct Layer 1 Head 27**
* **Meaningless tokens (Blue):** The attention weights are relatively low and stable, generally staying below 0.02. There is a slight increase in attention weight towards the end of the sequence, reaching approximately 0.02 around step 100.
* **Random sentence (Red):** The attention weights fluctuate more than the "Meaningless tokens", with several spikes reaching values between 0.02 and 0.04. The spikes are more frequent and pronounced than the "Meaningless tokens" line.
**Right Chart: Gemma3-4b-it Layer 1 Head 8**
* **Meaningless tokens (Blue):** The attention weights are generally low, mostly below 0.1, with a significant spike at the end of the sequence (around step 115), reaching a value of approximately 0.58.
* **Random sentence (Red):** The attention weights fluctuate, with small spikes throughout the sequence. The spikes are more frequent towards the end of the sequence, with values generally below 0.1, except for the final spike which reaches approximately 0.5.
### Key Observations
* In all three graphs, the "Random sentence" line shows more frequent and pronounced spikes compared to the "Meaningless tokens" line, indicating higher variability in attention weights.
* The Qwen2.5-7B-Math model shows the most distinct spikes for both "Meaningless tokens" and "Random sentence".
* The Gemma3-4b-it model shows a dramatic spike at the end of the sequence for both "Meaningless tokens" and "Random sentence".
* The Llama3.1-8B-Instruct model shows the most stable attention weights for "Meaningless tokens".
### Interpretation
The graphs compare how different language models (Qwen, Llama, and Gemma) attend to "Meaningless tokens" versus a "Random sentence" in specific layers and heads. The attention weights indicate the importance the model assigns to each token in the sequence.
The higher variability and spikes in the "Random sentence" line suggest that these models are more sensitive to the specific content of a random sentence compared to meaningless tokens. The spikes likely correspond to specific words or phrases within the random sentence that the model deems important for processing.
The dramatic spike at the end of the sequence in the Gemma3-4b-it model suggests that this model may be particularly sensitive to the final tokens in the sequence, possibly indicating a focus on context completion or summarization.
The relatively stable attention weights for "Meaningless tokens" in the Llama3.1-8B-Instruct model suggest that this model may be more robust to irrelevant or noisy input.
The differences in attention patterns across the three models highlight the varying strategies employed by different architectures and training regimes in processing language.