## Donut Chart: KGoT Runtime Distribution
### Overview
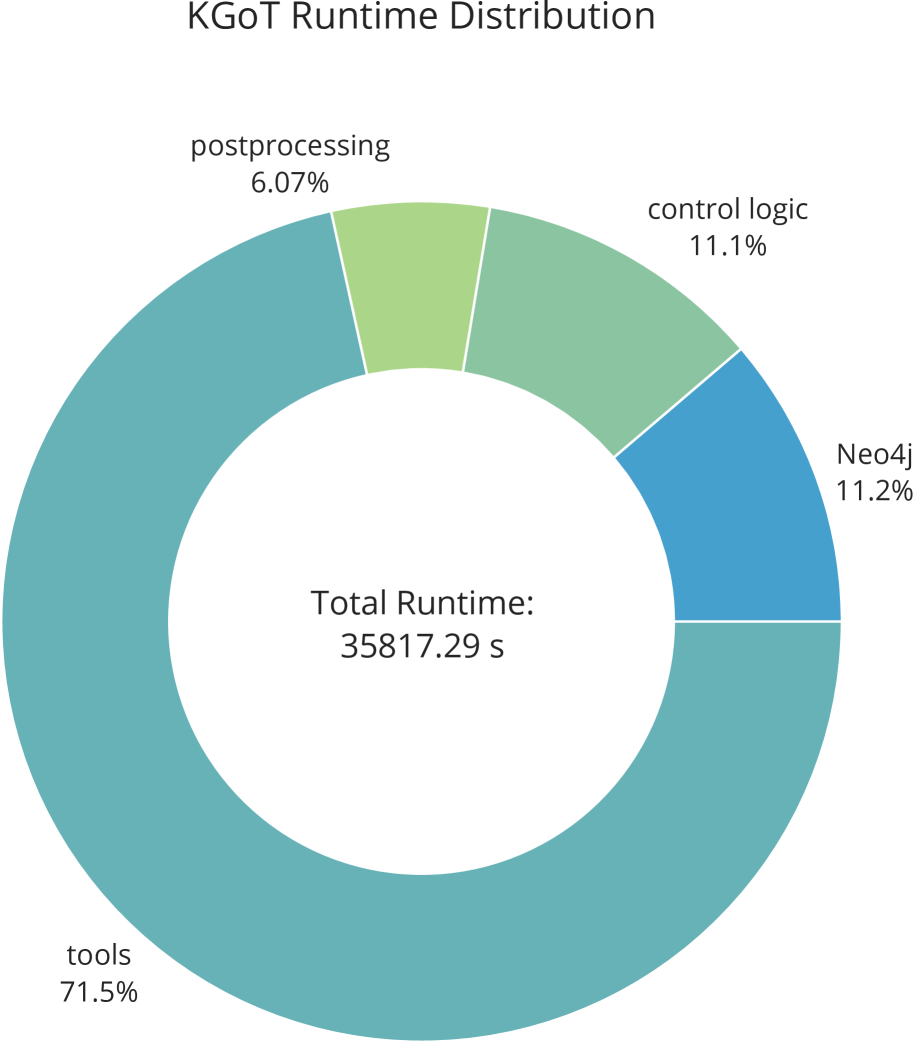
This image is a donut chart (a pie chart with a central hole) titled "KGoT Runtime Distribution." It visualizes the proportional breakdown of total runtime for a system or process called "KGoT" across four distinct components. The total runtime is explicitly stated in the center of the chart.
### Components/Axes
* **Chart Title:** "KGoT Runtime Distribution" (located at the top center).
* **Central Information:** "Total Runtime: 35817.29 s" (located in the white central hole of the donut).
* **Segments & Labels:** The chart is divided into four colored segments, each with an associated label and percentage placed outside the segment.
* **Segment 1 (Largest, Teal):** Label "tools", Percentage "71.5%". Positioned from approximately the 7 o'clock to 4 o'clock position (spanning the bottom and left side).
* **Segment 2 (Blue):** Label "Neo4j", Percentage "11.2%". Positioned from approximately the 4 o'clock to 2 o'clock position (right side).
* **Segment 3 (Light Green):** Label "control logic", Percentage "11.1%". Positioned from approximately the 2 o'clock to 12 o'clock position (top-right).
* **Segment 4 (Lightest Green):** Label "postprocessing", Percentage "6.07%". Positioned from approximately the 12 o'clock to 11 o'clock position (top-left).
### Detailed Analysis
The chart provides a precise percentage breakdown of the total 35,817.29 seconds of runtime.
1. **tools:** 71.5% of the total runtime.
* *Calculated Approximate Value:* 0.715 * 35817.29 s ≈ 25,609.36 s.
* *Visual Trend:* This is the dominant segment, occupying nearly three-quarters of the chart.
2. **Neo4j:** 11.2% of the total runtime.
* *Calculated Approximate Value:* 0.112 * 35817.29 s ≈ 4,011.54 s.
* *Visual Trend:* The second-largest segment, roughly equal in size to "control logic".
3. **control logic:** 11.1% of the total runtime.
* *Calculated Approximate Value:* 0.111 * 35817.29 s ≈ 3,975.72 s.
* *Visual Trend:* Nearly identical in proportion to "Neo4j".
4. **postprocessing:** 6.07% of the total runtime.
* *Calculated Approximate Value:* 0.0607 * 35817.29 s ≈ 2,174.11 s.
* *Visual Trend:* The smallest segment.
**Note on Precision:** The percentages sum to 99.87% (71.5 + 11.2 + 11.1 + 6.07). The missing 0.13% is likely due to rounding in the displayed percentages.
### Key Observations
* **Dominant Component:** The "tools" component is overwhelmingly the largest contributor to the KGoT runtime, accounting for more than double the combined time of all other components.
* **Secondary Components:** "Neo4j" and "control logic" are nearly identical in their runtime share (~11% each).
* **Minor Component:** "postprocessing" represents a relatively small fraction of the total time.
* **Total Runtime:** The system's total measured runtime is substantial, at approximately 35,817 seconds, which is roughly 9 hours and 57 minutes.
### Interpretation
This chart clearly demonstrates that the performance bottleneck of the KGoT system lies within the "tools" component. Any effort to optimize the overall runtime should prioritize this segment, as even a modest percentage improvement here would yield the largest absolute time savings. The near-equal split between "Neo4j" (likely a database interaction layer) and "control logic" suggests these are secondary but significant areas for potential optimization. "postprocessing" is a minor factor in the current runtime profile.
The data suggests a system architecture where the core "tools" execution is the most computationally expensive phase, while database operations and control flow management are secondary, and final post-processing is relatively lightweight. The precise total runtime value (35817.29 s) indicates this is based on measured empirical data, not an estimate.