## Line Chart: Nesting Depth vs. Number of Failed LLMs
### Overview
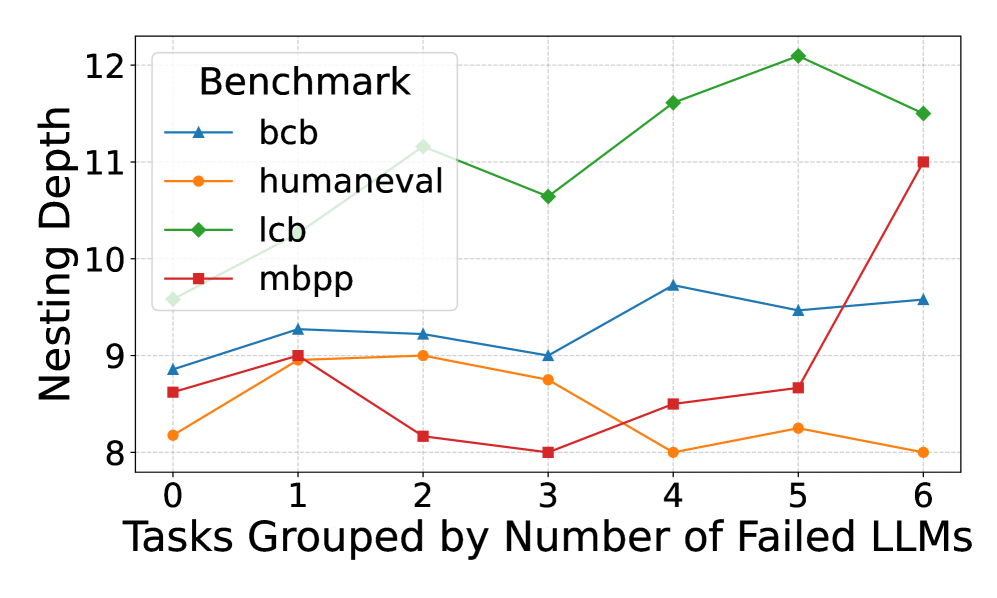
This is a line chart comparing the "Nesting Depth" of code across four different programming benchmarks (bcb, humaneval, lcb, mbpp) as a function of the number of Large Language Models (LLMs) that failed to solve a given task. The chart suggests an analysis of code complexity in relation to task difficulty for AI models.
### Components/Axes
* **Chart Type:** Multi-line chart with markers.
* **X-Axis:**
* **Label:** "Tasks Grouped by Number of Failed LLMs"
* **Scale:** Linear, integer values from 0 to 6.
* **Interpretation:** Represents groups of tasks. The value indicates how many LLMs failed on those tasks (e.g., "0" means tasks all LLMs solved, "6" means tasks all LLMs failed).
* **Y-Axis:**
* **Label:** "Nesting Depth"
* **Scale:** Linear, ranging from 8 to 12.
* **Interpretation:** A measure of code complexity, likely the maximum depth of nested control structures (like loops, conditionals) in the solution code.
* **Legend:**
* **Title:** "Benchmark"
* **Position:** Top-left corner of the plot area.
* **Entries:**
1. **bcb:** Blue line with upward-pointing triangle markers.
2. **humaneval:** Orange line with circle markers.
3. **lcb:** Green line with diamond markers.
4. **mbpp:** Red line with square markers.
### Detailed Analysis
**Data Series Trends and Approximate Values:**
1. **bcb (Blue, Triangle):**
* **Trend:** Shows a moderate, fluctuating upward trend. It starts in the middle of the pack, peaks at x=4, and ends as the second highest.
* **Data Points (x, y ≈):**
* (0, 8.8)
* (1, 9.3)
* (2, 9.2)
* (3, 9.0)
* (4, 9.7)
* (5, 9.5)
* (6, 9.6)
2. **humaneval (Orange, Circle):**
* **Trend:** Shows a slight overall downward trend. It starts low, peaks at x=1 and x=2, then generally declines, ending as the lowest series.
* **Data Points (x, y ≈):**
* (0, 8.2)
* (1, 9.0)
* (2, 9.0)
* (3, 8.8)
* (4, 8.0)
* (5, 8.2)
* (6, 8.0)
3. **lcb (Green, Diamond):**
* **Trend:** Shows a strong, consistent upward trend. It starts as the highest series and maintains the highest nesting depth throughout, peaking at x=5.
* **Data Points (x, y ≈):**
* (0, 9.6)
* (1, 10.3)
* (2, 11.2)
* (3, 10.7)
* (4, 11.6)
* (5, 12.1)
* (6, 11.5)
4. **mbpp (Red, Square):**
* **Trend:** Shows a volatile trend with a dramatic, sharp increase at the end. It starts low, dips at x=2 and x=3, then rises sharply from x=4 to x=6, ending as the second highest.
* **Data Points (x, y ≈):**
* (0, 8.6)
* (1, 9.0)
* (2, 8.2)
* (3, 8.0)
* (4, 8.5)
* (5, 8.7)
* (6, 11.0)
### Key Observations
1. **Benchmark Hierarchy:** The `lcb` benchmark consistently exhibits the highest nesting depth across all task difficulty groups, suggesting its solutions are structurally more complex.
2. **Difficulty Correlation:** For the `lcb` and, to a lesser extent, `bcb` benchmarks, there is a positive correlation between the number of failed LLMs (task difficulty) and the nesting depth of the solutions. This implies that tasks harder for AI models may require more complex code structures.
3. **Anomaly - mbpp Spike:** The `mbpp` series shows a significant outlier behavior. Its nesting depth is relatively low and stable for tasks where 0-5 LLMs failed, but it spikes dramatically (from ~8.7 to 11.0) for the hardest task group (6 failed LLMs). This suggests a subset of very difficult `mbpp` tasks that require a sudden jump in structural complexity.
4. **Convergence at Low Difficulty:** For tasks solved by all LLMs (x=0), the nesting depths are relatively clustered between 8.2 and 9.6. The spread widens significantly as task difficulty increases.
### Interpretation
This chart provides a technical lens into the relationship between AI model performance and code structure. The data suggests that **task difficulty for LLMs is not always aligned with human-perceived code complexity**, but a correlation exists for certain benchmarks.
* The `lcb` benchmark's high and rising nesting depth indicates it may contain problems that are inherently complex to structure, which also makes them challenging for LLMs.
* The `mbpp` spike is particularly insightful. It could indicate a "complexity cliff" – a point where solving the problem requires a fundamentally different, more nested algorithmic approach that most LLMs fail to generate. This highlights a potential limitation in LLM reasoning for specific types of hard problems.
* The relative stability of `humaneval` suggests its difficulty for LLMs may be driven more by other factors (e.g., semantic understanding, edge cases) rather than deep structural nesting.
In summary, the chart moves beyond simple pass/fail metrics to show how the *nature* of the code solution (its nesting depth) varies with task difficulty across different standardized benchmarks. This is valuable for understanding the strengths and weaknesses of LLM code generation.