## Chart: Scaling Performance and Efficiency Analysis
### Overview
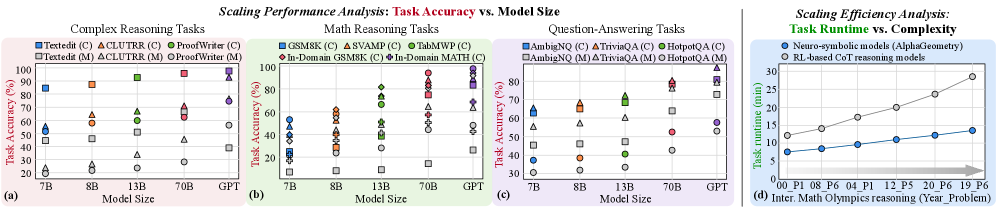
The image presents four scatter plots analyzing the scaling performance and efficiency of different models across various tasks. The first three plots (a, b, c) depict "Task Accuracy vs. Model Size" for Complex Reasoning, Math Reasoning, and Question-Answering tasks, respectively. The fourth plot (d) shows "Task Runtime vs. Complexity" for Neuro-symbolic and RL-based models.
### Components/Axes
**General:**
* **Title:** Scaling Performance Analysis: Task Accuracy vs. Model Size (for plots a, b, c) and Scaling Efficiency Analysis: Task Runtime vs. Complexity (for plot d)
* Each plot is labeled with a letter: (a), (b), (c), (d) in the bottom left corner.
**Plot (a): Complex Reasoning Tasks**
* **X-axis:** Model Size (7B, 8B, 13B, 70B, GPT)
* **Y-axis:** Task Accuracy (%) (Scale from 0 to 100, increments of 20)
* **Legend (top-left):**
* Blue Square: Textedit (C)
* Orange Triangle: ACLUTRR (C)
* Green Circle: ProofWriter (C)
* Gray Square: Textedit (M)
* Gray Triangle: ACLUTRR (M)
* Gray Circle: ProofWriter (M)
**Plot (b): Math Reasoning Tasks**
* **X-axis:** Model Size (7B, 8B, 13B, 70B, GPT)
* **Y-axis:** Task Accuracy (%) (Scale from 0 to 100, increments of 20)
* **Legend (top-left):**
* Blue Square: GSM8K (C)
* Orange Triangle: SVAMP (C)
* Green Circle: TabMWP (C)
* Red Diamond: In-Domain GSM8K (C)
* Purple Diamond: In-Domain MATH (C)
**Plot (c): Question-Answering Tasks**
* **X-axis:** Model Size (7B, 8B, 13B, 70B, GPT)
* **Y-axis:** Task Accuracy (%) (Scale from 30 to 80, increments of 10)
* **Legend (top-left):**
* Blue Square: AmbigNQ (C)
* Orange Triangle: TriviaQA (C)
* Green Circle: HotpotQA (C)
* Gray Square: AmbigNQ (M)
* Gray Triangle: TriviaQA (M)
* Gray Circle: HotpotQA (M)
**Plot (d): Task Runtime vs. Complexity**
* **X-axis:** Inter. Math Olympics reasoning (Year_Problem) (00_P1, 08_P6, 04_P1, 12_P5, 20_P6, 19_P6)
* **Y-axis:** Task runtime (min) (Scale from 5 to 30, increments of 5)
* **Legend (top-right):**
* Blue Circle: Neuro-symbolic models (AlphaGeometry)
* Gray Circle: RL-based CoT reasoning models
* There is a right-pointing arrow at the bottom of the chart, indicating increasing complexity.
### Detailed Analysis
**Plot (a): Complex Reasoning Tasks**
* **Textedit (C):** Accuracy increases from approximately 85% at 7B to 98% at 70B.
* **ACLUTRR (C):** Accuracy increases from approximately 58% at 7B to 70% at 70B.
* **ProofWriter (C):** Accuracy increases from approximately 20% at 7B to 65% at 13B, then to 70% at 70B.
* **Textedit (M):** Accuracy increases from approximately 45% at 7B to 48% at 8B, then to 55% at 13B, and then decreases to 45% at 70B.
* **ACLUTRR (M):** Accuracy increases from approximately 25% at 7B to 35% at 13B, then to 45% at 70B.
* **ProofWriter (M):** Accuracy increases from approximately 20% at 7B to 25% at 8B, then to 25% at 13B, and then to 30% at 70B.
**Plot (b): Math Reasoning Tasks**
* The data points are scattered, making it difficult to discern clear trends for each model.
* **GSM8K (C):** Accuracy ranges from approximately 20% to 55%.
* **SVAMP (C):** Accuracy ranges from approximately 25% to 75%.
* **TabMWP (C):** Accuracy ranges from approximately 30% to 95%.
* **In-Domain GSM8K (C):** Accuracy ranges from approximately 40% to 75%.
* **In-Domain MATH (C):** Accuracy ranges from approximately 10% to 35%.
**Plot (c): Question-Answering Tasks**
* **AmbigNQ (C):** Accuracy increases from approximately 65% at 7B to 70% at 8B, then to 75% at 13B, and then to 80% at 70B.
* **TriviaQA (C):** Accuracy increases from approximately 55% at 7B to 68% at 8B, then to 60% at 13B, and then to 80% at 70B.
* **HotpotQA (C):** Accuracy increases from approximately 38% at 7B to 40% at 8B, then to 65% at 13B, and then to 75% at 70B.
* **AmbigNQ (M):** Accuracy increases from approximately 45% at 7B to 55% at 8B, then to 58% at 13B, and then to 75% at 70B.
* **TriviaQA (M):** Accuracy increases from approximately 50% at 7B to 58% at 8B, then to 58% at 13B, and then to 75% at 70B.
* **HotpotQA (M):** Accuracy increases from approximately 30% at 7B to 30% at 8B, then to 40% at 13B, and then to 50% at 70B.
**Plot (d): Task Runtime vs. Complexity**
* **Neuro-symbolic models (AlphaGeometry):** Task runtime increases linearly from approximately 8 minutes to 15 minutes as complexity increases.
* **RL-based CoT reasoning models:** Task runtime increases linearly from approximately 12 minutes to 28 minutes as complexity increases.
### Key Observations
* For Complex Reasoning and Question-Answering tasks, the "C" versions of the models generally outperform the "M" versions.
* In Math Reasoning tasks, the performance varies significantly across different models and model sizes.
* In the Task Runtime vs. Complexity plot, RL-based CoT reasoning models consistently have higher task runtime compared to Neuro-symbolic models (AlphaGeometry).
* The GPT model size is only present in the Task Accuracy plots, and not in the Task Runtime plot.
### Interpretation
The data suggests that increasing model size generally improves task accuracy for Complex Reasoning and Question-Answering tasks, but the effect is less consistent for Math Reasoning tasks. The difference in performance between "C" and "M" versions of the models indicates that certain model architectures or training methods are more effective for specific tasks. The Task Runtime vs. Complexity plot highlights a trade-off between model type and computational cost, with Neuro-symbolic models demonstrating lower runtime compared to RL-based models for the same level of complexity. The arrow on the x-axis of plot (d) indicates that the problems are ordered by increasing difficulty.