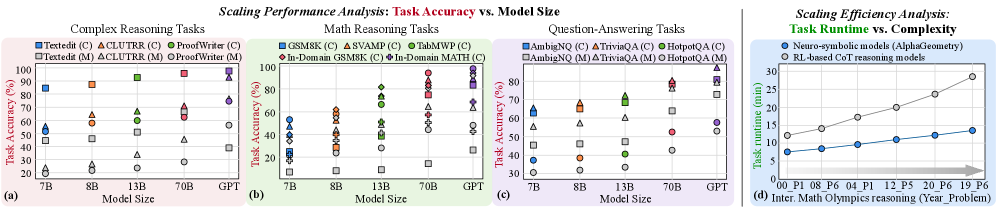
This image contains four distinct charts, labeled (a) through (d), analyzing the performance and efficiency of various AI models across different tasks.
## Multi-Panel Chart: Scaling Performance and Efficiency Analysis
### Overview
The image is a composite of four sub-charts. Panels (a), (b), and (c) display "Task Accuracy vs. Model Size" for three different categories of reasoning tasks. Panel (d) displays "Task Runtime vs. Complexity" for International Math Olympiad problems. The charts compare different model sizes (7B, 8B, 13B, 70B, GPT) and different reasoning methodologies (denoted by (C) and (M) in the legends).
### Components/Axes
**Panels (a), (b), and (c):**
* **X-Axis:** Model Size, with categories: 7B, 8B, 13B, 70B, GPT.
* **Y-Axis:** Task Accuracy (%), ranging from 20% to 100% (or 30% to 90% in panel c).
* **Legends:**
* **(a) Complex Reasoning Tasks:**
* Textedit (C) [Blue Square], Textedit (M) [Grey Square]
* CLUTRR (C) [Orange Triangle], CLUTRR (M) [Grey Triangle]
* ProofWriter (C) [Green Circle], ProofWriter (M) [Grey Circle]
* **(b) Math Reasoning Tasks:**
* GSM8K (C) [Blue Square], GSM8K (M) [Grey Square]
* SVAMP (C) [Orange Triangle], SVAMP (M) [Grey Triangle]
* TabMWP (C) [Green Circle], TabMWP (M) [Grey Circle]
* In-Domain GSM8K (C) [Red Diamond]
* In-Domain MATH (C) [Purple Diamond]
* **(c) Question-Answering Tasks:**
* AmbigNQ (C) [Blue Square], AmbigNQ (M) [Grey Square]
* TriviaQA (C) [Orange Triangle], TriviaQA (M) [Grey Triangle]
* HotpotQA (C) [Green Circle], HotpotQA (M) [Grey Circle]
**Panel (d):**
* **X-Axis:** Inter. Math Olympics reasoning (Year_Problem), with categories: 00_P1, 08_P6, 04_P1, 12_P5, 20_P6, 19_P6.
* **Y-Axis:** Task runtime (min), ranging from 0 to 30.
* **Legend:**
* Neuro-symbolic models (AlphaGeometry) [Blue Circle]
* RL-based CoT reasoning models [Grey Circle]
---
### Detailed Analysis
#### Panel (a): Complex Reasoning Tasks
* **Trend:** All (C) series show a general upward trend as model size increases. The (M) series are consistently lower than their (C) counterparts and show flatter growth.
* **Data Points:**
* At 7B, accuracy ranges from ~20% (ProofWriter M) to ~85% (Textedit C).
* At GPT, accuracy ranges from ~40% (Textedit M) to ~95% (ProofWriter C).
#### Panel (b): Math Reasoning Tasks
* **Trend:** High variance in performance. (C) variants generally outperform (M) variants. The In-Domain (C) models (Red and Purple diamonds) show the highest performance at the 70B and GPT levels.
* **Data Points:**
* At 7B, accuracy is clustered between ~10% and ~55%.
* At GPT, accuracy is clustered between ~25% and ~95%.
#### Panel (c): Question-Answering Tasks
* **Trend:** All series show a clear, consistent upward slope from 7B to GPT.
* **Data Points:**
* At 7B, accuracy ranges from ~30% (HotpotQA M) to ~65% (AmbigNQ C).
* At GPT, accuracy ranges from ~55% (HotpotQA M) to ~90% (AmbigNQ C).
#### Panel (d): Scaling Efficiency Analysis
* **Trend:** Both model types show an upward slope, indicating that as problem complexity increases (left to right), runtime increases.
* **Data Points:**
* **Neuro-symbolic models (Blue):** Starts at ~7 minutes (00_P1) and rises steadily to ~13 minutes (19_P6).
* **RL-based CoT models (Grey):** Starts at ~12 minutes (00_P1) and rises more steeply to ~29 minutes (19_P6).
---
### Key Observations
1. **Methodology Gap:** In panels (a), (b), and (c), the (C) variants (likely Chain-of-Thought) consistently outperform the (M) variants across all model sizes.
2. **Scaling Returns:** Increasing model size generally correlates with higher task accuracy, though the rate of improvement varies by task type.
3. **Efficiency Divergence:** In panel (d), the gap between the Neuro-symbolic models and RL-based CoT models widens as the complexity of the math problems increases. The Neuro-symbolic approach is significantly more efficient (faster) than the RL-based CoT approach.
### Interpretation
The data demonstrates a clear hierarchy in performance based on methodology: the (C) variants are superior to (M) variants for reasoning tasks. Furthermore, the charts suggest that while scaling model size (up to GPT) improves accuracy, it does not eliminate the performance gap between different task types or methodologies.
Panel (d) provides a critical insight into the trade-offs of AI reasoning: while RL-based CoT models are a common approach, they are computationally more expensive (slower) than Neuro-symbolic models like AlphaGeometry. As problem complexity increases, the RL-based models' runtime grows significantly faster than the Neuro-symbolic models, suggesting that Neuro-symbolic architectures may be more scalable for high-complexity reasoning tasks where time efficiency is a constraint.