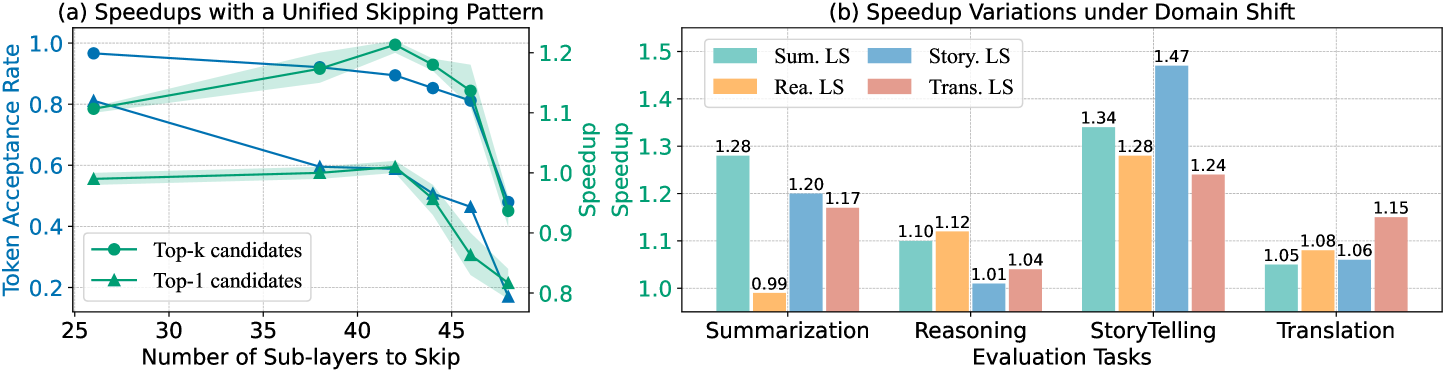
## Combined Chart: Speedups and Domain Shift Variations
### Overview
The image presents two charts side-by-side. Chart (a) on the left shows the relationship between the number of sub-layers skipped and the token acceptance rate for Top-k and Top-1 candidates. Chart (b) on the right displays speedup variations under domain shift across different evaluation tasks (Summarization, Reasoning, StoryTelling, and Translation) for four different scenarios (Sum. LS, Story. LS, Rea. LS, and Trans. LS).
### Components/Axes
**Chart (a): Speedups with a Unified Skipping Pattern**
* **Title:** Speedups with a Unified Skipping Pattern
* **X-axis:** Number of Sub-layers to Skip (ranging from 25 to 45 in increments of 5)
* **Y-axis (left):** Token Acceptance Rate (ranging from 0.2 to 1.0 in increments of 0.2)
* **Y-axis (right):** Speedup (ranging from 0.8 to 1.2 in increments of 0.1)
* **Legend (bottom-left):**
* Blue line with circle markers: Top-k candidates
* Green line with triangle markers: Top-1 candidates
**Chart (b): Speedup Variations under Domain Shift**
* **Title:** Speedup Variations under Domain Shift
* **X-axis:** Evaluation Tasks (Summarization, Reasoning, StoryTelling, Translation)
* **Y-axis:** Speedup (ranging from 0.9 to 1.5 in increments of 0.1)
* **Legend (top-left):**
* Light Blue: Sum. LS
* Blue: Story. LS
* Orange: Rea. LS
* Light Red: Trans. LS
### Detailed Analysis
**Chart (a): Speedups with a Unified Skipping Pattern**
* **Top-k candidates (Blue line):**
* The line starts at approximately 0.97 at 25 sub-layers.
* It decreases to approximately 0.9 at 40 sub-layers.
* It then decreases sharply to approximately 0.9 at 45 sub-layers.
* **Top-1 candidates (Green line):**
* The line starts at approximately 0.8 at 25 sub-layers.
* It increases to approximately 0.98 at 40 sub-layers.
* It then decreases sharply to approximately 0.8 at 45 sub-layers.
**Chart (b): Speedup Variations under Domain Shift**
* **Summarization:**
* Sum. LS (Light Blue): 1.28
* Rea. LS (Orange): 0.99
* Story. LS (Blue): 1.20
* Trans. LS (Light Red): 1.17
* **Reasoning:**
* Sum. LS (Light Blue): 1.10
* Rea. LS (Orange): 1.12
* Story. LS (Blue): 1.01
* Trans. LS (Light Red): 1.04
* **StoryTelling:**
* Sum. LS (Light Blue): 1.34
* Rea. LS (Orange): 1.28
* Story. LS (Blue): 1.47
* Trans. LS (Light Red): 1.24
* **Translation:**
* Sum. LS (Light Blue): 1.05
* Rea. LS (Orange): 1.08
* Story. LS (Blue): 1.06
* Trans. LS (Light Red): 1.15
### Key Observations
* In Chart (a), the token acceptance rate for Top-k candidates generally decreases as the number of sub-layers skipped increases. The token acceptance rate for Top-1 candidates generally increases as the number of sub-layers skipped increases, then decreases sharply.
* In Chart (b), the speedup varies significantly across different evaluation tasks and scenarios. StoryTelling shows the highest speedup for Story. LS, while Reasoning shows the lowest speedup overall.
### Interpretation
Chart (a) suggests that skipping more sub-layers initially improves the token acceptance rate for Top-1 candidates, but eventually, skipping too many sub-layers degrades the performance for both Top-k and Top-1 candidates. Chart (b) indicates that the effectiveness of different strategies (Sum. LS, Story. LS, Rea. LS, Trans. LS) is highly dependent on the specific evaluation task. StoryTelling benefits most from the Story. LS strategy, while Reasoning shows relatively low speedups across all strategies. The domain shift significantly impacts the speedup achieved by each strategy.