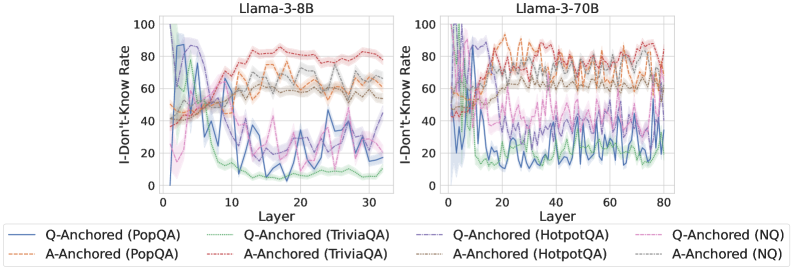
## Chart: I-Don't-Know Rate vs. Layer for Llama-3 Models
### Overview
The image presents two line charts comparing the "I-Don't-Know Rate" across different layers of two Llama-3 models (8B and 70B). Each chart displays the rate for various question-answering datasets (PopQA, TriviaQA, HotpotQA, and NQ) using both question-anchored (Q-Anchored) and answer-anchored (A-Anchored) approaches. The x-axis represents the layer number, and the y-axis represents the I-Don't-Know Rate.
### Components/Axes
* **Titles:**
* Left Chart: "Llama-3-8B"
* Right Chart: "Llama-3-70B"
* **Y-Axis:**
* Label: "I-Don't-Know Rate"
* Scale: 0 to 100, with tick marks at 0, 20, 40, 60, 80, and 100.
* **X-Axis:**
* Label: "Layer"
* Left Chart Scale: 0 to 30, with tick marks at 0, 10, 20, and 30.
* Right Chart Scale: 0 to 80, with tick marks at 0, 20, 40, 60, and 80.
* **Legend:** Located at the bottom of the image.
* Q-Anchored (PopQA): Solid blue line
* A-Anchored (PopQA): Dashed brown line
* Q-Anchored (TriviaQA): Dotted green line
* A-Anchored (TriviaQA): Dash-dot gray line
* Q-Anchored (HotpotQA): Dash-dot-dot red line
* A-Anchored (HotpotQA): Dotted orange line
* Q-Anchored (NQ): Dashed pink line
* A-Anchored (NQ): Dash-dot black line
### Detailed Analysis
**Llama-3-8B (Left Chart):**
* **Q-Anchored (PopQA):** (Solid Blue) Starts at approximately 0, rises sharply to around 90 by layer 5, then fluctuates between 10 and 40 for the remaining layers.
* **A-Anchored (PopQA):** (Dashed Brown) Starts at approximately 40, rises to around 60 by layer 10, and then fluctuates between 50 and 70 for the remaining layers.
* **Q-Anchored (TriviaQA):** (Dotted Green) Starts at approximately 50, drops to around 10 by layer 10, and then fluctuates between 10 and 30 for the remaining layers.
* **A-Anchored (TriviaQA):** (Dash-dot Gray) Starts at approximately 50, rises to around 60 by layer 10, and then fluctuates between 50 and 60 for the remaining layers.
* **Q-Anchored (HotpotQA):** (Dash-dot-dot Red) Starts at approximately 40, rises to around 90 by layer 10, and then fluctuates between 70 and 90 for the remaining layers.
* **A-Anchored (HotpotQA):** (Dotted Orange) Starts at approximately 40, rises to around 70 by layer 10, and then fluctuates between 60 and 70 for the remaining layers.
* **Q-Anchored (NQ):** (Dashed Pink) Starts at approximately 40, rises to around 60 by layer 10, and then fluctuates between 20 and 40 for the remaining layers.
* **A-Anchored (NQ):** (Dash-dot Black) Starts at approximately 50, rises to around 60 by layer 10, and then fluctuates between 50 and 60 for the remaining layers.
**Llama-3-70B (Right Chart):**
* **Q-Anchored (PopQA):** (Solid Blue) Starts at approximately 20, fluctuates between 10 and 40 across all layers.
* **A-Anchored (PopQA):** (Dashed Brown) Starts at approximately 60, fluctuates between 70 and 90 across all layers.
* **Q-Anchored (TriviaQA):** (Dotted Green) Starts at approximately 40, fluctuates between 10 and 30 across all layers.
* **A-Anchored (TriviaQA):** (Dash-dot Gray) Starts at approximately 60, fluctuates between 60 and 80 across all layers.
* **Q-Anchored (HotpotQA):** (Dash-dot-dot Red) Starts at approximately 60, fluctuates between 70 and 90 across all layers.
* **A-Anchored (HotpotQA):** (Dotted Orange) Starts at approximately 60, fluctuates between 70 and 90 across all layers.
* **Q-Anchored (NQ):** (Dashed Pink) Starts at approximately 40, fluctuates between 20 and 50 across all layers.
* **A-Anchored (NQ):** (Dash-dot Black) Starts at approximately 60, fluctuates between 60 and 80 across all layers.
### Key Observations
* The I-Don't-Know Rate varies significantly depending on the dataset and anchoring method (Q-Anchored vs. A-Anchored).
* The Llama-3-70B model shows more consistent I-Don't-Know Rates across layers compared to the Llama-3-8B model, which exhibits more pronounced initial changes in the first 10 layers.
* For both models, A-Anchored approaches generally result in higher I-Don't-Know Rates than Q-Anchored approaches for PopQA, TriviaQA, and NQ datasets.
* HotpotQA shows high I-Don't-Know Rates for both Q-Anchored and A-Anchored approaches in both models.
### Interpretation
The charts illustrate how the "I-Don't-Know Rate" changes across different layers of the Llama-3 models when processing various question-answering datasets. The differences between Q-Anchored and A-Anchored approaches suggest that the way questions and answers are processed significantly impacts the model's confidence in its responses. The higher I-Don't-Know Rates for HotpotQA may indicate that this dataset poses a greater challenge for the models, possibly due to its complexity or the type of reasoning required. The more stable rates in the Llama-3-70B model suggest that larger models might have more consistent performance across layers. The initial fluctuations in the Llama-3-8B model could indicate that the earlier layers are more critical for learning and adapting to the specific dataset.