## Diagram: Data Retention and Prediction Workflow Architecture
### Overview
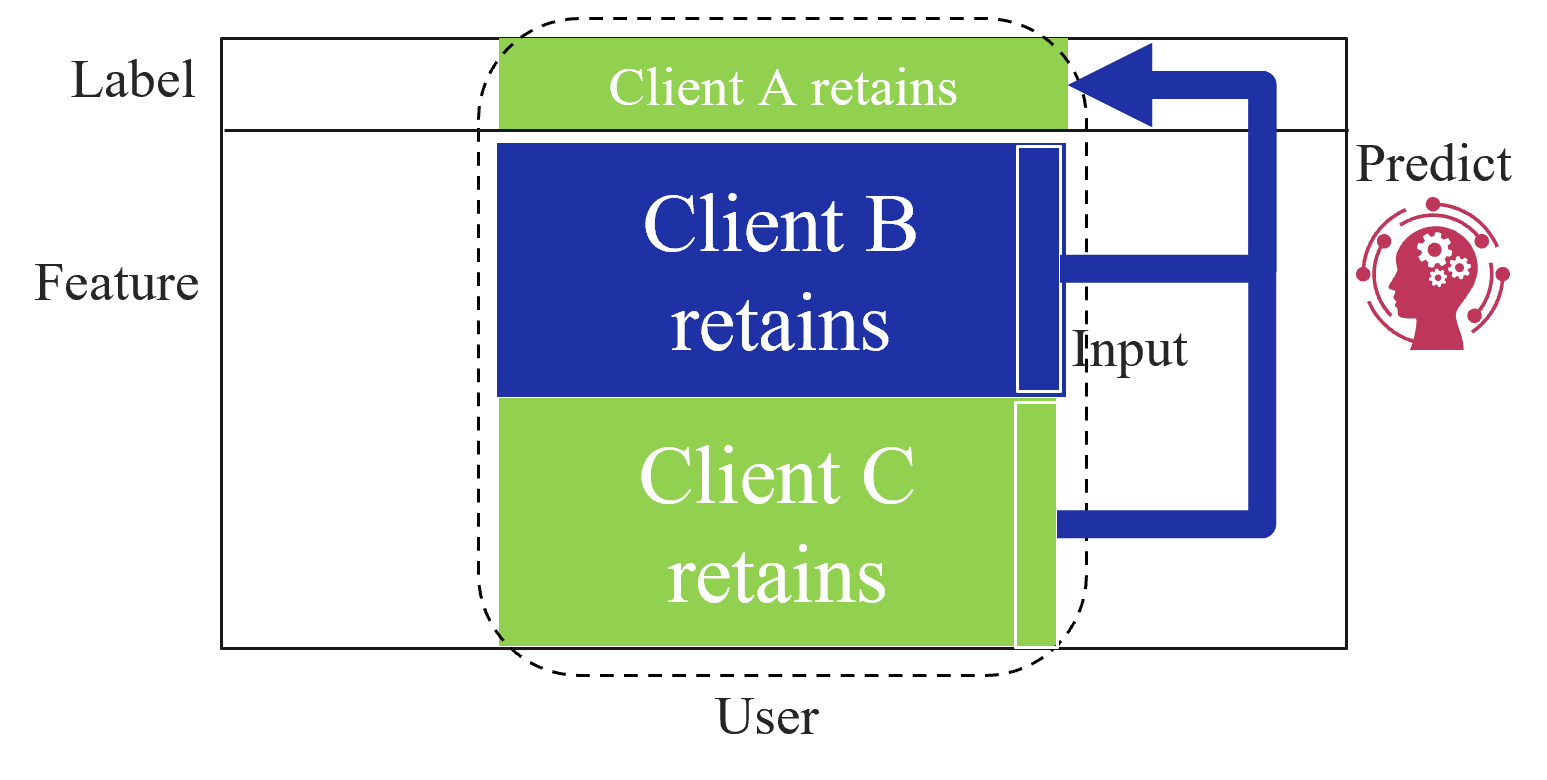
The image is a schematic diagram illustrating a data processing or machine learning workflow. It depicts a system where data from three distinct entities ("Client A", "Client B", and "Client C") is retained and processed as an "Input" to a "Predict" function. The diagram uses color-coded blocks and directional arrows to suggest a flow of information.
### Components/Axes
* **Main Container:** A large, thin-lined rectangular frame containing a dashed-line rounded rectangle.
* **Data Blocks (Stacked Vertically):**
* **Top:** Light green block labeled "Client A retains".
* **Middle:** Dark blue block labeled "Client B retains".
* **Bottom:** Light green block labeled "Client C retains".
* **External Labels:**
* **"Label"**: Positioned at the top-left, outside the main container.
* **"Feature"**: Positioned at the middle-left, outside the main container.
* **"User"**: Positioned at the bottom-center, outside the main container.
* **"Predict"**: Positioned at the top-right, accompanied by an icon depicting a human head silhouette containing gears (symbolizing AI/Machine Learning).
* **Flow/Process Elements:**
* **"Input"**: A vertical text label positioned on the right side of the stacked blocks, adjacent to a vertical white bar that spans the height of the blocks.
* **Blue Arrow**: A thick, right-angled blue arrow originating from the "Input" region on the right, pointing upwards to the "Predict" section.
### Detailed Analysis
* **Spatial Layout:**
* The diagram is organized into a left-to-right and bottom-to-top flow. The "Label", "Feature", and "User" labels on the left act as descriptors or dimensions for the data contained within the central blocks.
* The "Client" blocks are centrally located within the dashed-line boundary.
* The "Predict" function is positioned at the top-right, serving as the destination for the data flow.
* **Color Coding:**
* **Light Green:** Used for "Client A retains" and "Client C retains".
* **Dark Blue:** Used for "Client B retains" and the feedback/flow arrow.
* **Data Flow:**
* The "Input" label and the associated vertical white bar suggest that data is being extracted or read from the "Client" blocks.
* The blue arrow indicates a directional movement of data from the "Input" area into the "Predict" module.
### Key Observations
* **Asymmetry in Retention:** While the blocks are uniform in size, the color coding (Green vs. Blue) implies a distinction between Client B and the others (Clients A and C), perhaps indicating different data types, priority levels, or retention policies.
* **System Integration:** The "Predict" icon (head with gears) strongly suggests that the "Input" is being fed into a machine learning model or an automated inference engine.
* **Contextual Labels:** The labels "Label", "Feature", and "User" on the left suggest that the data retained by the clients is categorized by these three dimensions.
### Interpretation
This diagram represents a high-level architectural view of a multi-tenant data pipeline.
1. **Data Categorization:** The labels "Label", "Feature", and "User" likely represent the schema or metadata associated with the data being processed.
2. **Multi-Tenancy:** The "Client A/B/C retains" blocks suggest that the system handles data for multiple clients, potentially with specific retention logic for each.
3. **Inference Loop:** The "Input" mechanism and the arrow pointing to "Predict" demonstrate that the system is designed to take the retained data, process it as an input, and generate a prediction.
4. **Investigative Note:** The visual distinction of "Client B" in dark blue, matching the color of the arrow, suggests that Client B's data might be the primary driver or the specific focus of the "Predict" function, or perhaps it represents a specific class of data currently being highlighted in the workflow. The "User" label at the bottom, centered, implies that the entire system is user-centric or that the "User" is the entity interacting with or generating the data for these clients.