## Diagram: Client Data Processing Architecture
### Overview
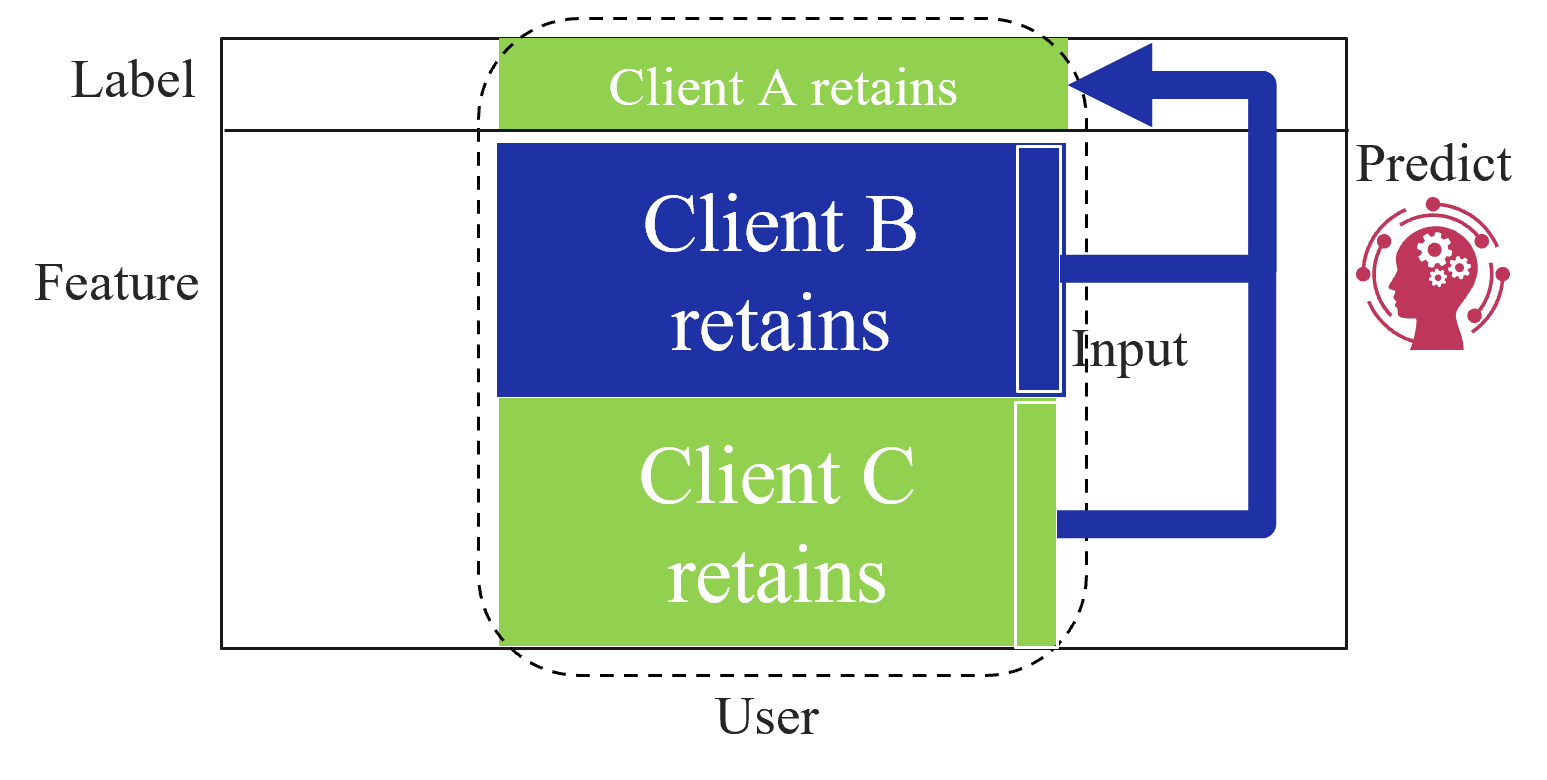
The diagram illustrates a multi-client data processing system with labeled sections for "Label," "Feature," and "User." Three clients (A, B, C) are represented with colored blocks, and arrows indicate data flow from input to prediction.
### Components/Axes
- **Vertical Sections**:
- **Label**: Topmost section, containing client-specific labels.
- **Feature**: Middle section, containing client-specific features.
- **User**: Bottom section, demarcated by a dashed line around Client C.
- **Horizontal Arrows**:
- **Input**: Blue arrow pointing to Client B’s feature block.
- **Predict**: Blue arrow with a brain icon (symbolizing neural processing) pointing to the right.
- **Color Coding**:
- **Green**: Client A and C (retains label/feature).
- **Blue**: Client B (retains feature, input focus).
### Detailed Analysis
- **Client A**: Green block in both "Label" and "Feature" sections, indicating retained data.
- **Client B**: Blue block in "Feature" section; input arrow highlights its role as the active input source.
- **Client C**: Green block in "Feature" section, enclosed by a dashed line in the "User" section, suggesting user-specific context.
- **Predict**: Arrows converge on a brain icon with gears/dots, symbolizing predictive modeling or inference.
### Key Observations
1. **Input Focus**: Client B’s feature is explicitly marked as the input source.
2. **Client Retention**: All clients retain labels/features, but Client B is prioritized for processing.
3. **User Context**: Client C’s dashed boundary implies segmentation for user-specific data.
4. **Predictive Flow**: Data from Client B’s features is routed to the prediction model.
### Interpretation
This diagram likely represents a federated learning or multi-client ML system where:
- **Client Data**: Each client (A, B, C) contributes labeled features, but Client B’s data is actively used for input.
- **Prediction**: The system processes Client B’s features to generate predictions, possibly for personalized recommendations or anomaly detection.
- **User Segmentation**: Client C’s dashed boundary suggests isolation for privacy or contextual relevance.
- **Color Significance**: Green (A/C) may denote stable/non-active clients, while blue (B) highlights active processing.
The architecture emphasizes modular client data handling with a focus on Client B for real-time prediction tasks.