## Line Charts: Direct vs. Belief-based Prediction Accuracy
### Overview
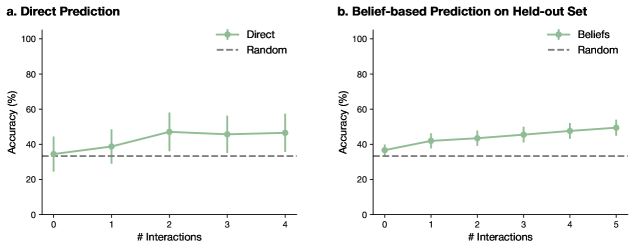
The image contains two side-by-side line charts comparing the performance of two prediction methods ("Direct" and "Beliefs") against a "Random" baseline. Both charts plot prediction accuracy (as a percentage) against the number of interactions. The charts are labeled "a. Direct Prediction" and "b. Belief-based Prediction on Held-out Set."
### Components/Axes
**Common Elements (Both Charts):**
* **Y-Axis:** Labeled "Accuracy (%)". Scale runs from 0 to 100, with major tick marks at 0, 20, 40, 60, 80, and 100.
* **X-Axis:** Labeled "# Interactions". Represents a discrete count of interactions.
* **Legend:** Located in the top-right corner of each chart's plot area.
* A green line with diamond markers represents the model's performance.
* A gray dashed line represents the "Random" baseline.
* **Data Series:** Each model's performance is shown as a green line with diamond markers at each data point. Vertical error bars extend above and below each marker.
**Chart-Specific Elements:**
* **Chart (a):**
* **Title:** "a. Direct Prediction"
* **X-Axis Range:** 0 to 4 interactions.
* **Legend Label for Green Line:** "Direct"
* **Chart (b):**
* **Title:** "b. Belief-based Prediction on Held-out Set"
* **X-Axis Range:** 0 to 5 interactions.
* **Legend Label for Green Line:** "Beliefs"
### Detailed Analysis
**Chart (a): Direct Prediction**
* **Trend:** The "Direct" method's accuracy shows an initial increase and then plateaus.
* **Data Points (Approximate):**
* Interactions: 0 | Accuracy: ~35% (Error bar spans ~25% to ~45%)
* Interactions: 1 | Accuracy: ~40% (Error bar spans ~30% to ~50%)
* Interactions: 2 | Accuracy: ~48% (Error bar spans ~38% to ~58%)
* Interactions: 3 | Accuracy: ~47% (Error bar spans ~37% to ~57%)
* Interactions: 4 | Accuracy: ~47% (Error bar spans ~37% to ~57%)
* **Random Baseline:** The dashed "Random" line is constant at approximately 33% accuracy across all interaction counts.
**Chart (b): Belief-based Prediction on Held-out Set**
* **Trend:** The "Beliefs" method's accuracy shows a steady, gradual increase across all measured interactions.
* **Data Points (Approximate):**
* Interactions: 0 | Accuracy: ~37% (Error bar spans ~30% to ~44%)
* Interactions: 1 | Accuracy: ~42% (Error bar spans ~35% to ~49%)
* Interactions: 2 | Accuracy: ~44% (Error bar spans ~37% to ~51%)
* Interactions: 3 | Accuracy: ~46% (Error bar spans ~39% to ~53%)
* Interactions: 4 | Accuracy: ~48% (Error bar spans ~41% to ~55%)
* Interactions: 5 | Accuracy: ~50% (Error bar spans ~43% to ~57%)
* **Random Baseline:** The dashed "Random" line is constant at approximately 33% accuracy across all interaction counts.
### Key Observations
1. **Superiority Over Random:** Both the "Direct" and "Beliefs" methods consistently outperform the "Random" baseline (33%) at every measured point after zero interactions.
2. **Performance Trajectory:** The "Direct" method (Chart a) appears to reach a performance ceiling or plateau after 2 interactions. In contrast, the "Beliefs" method (Chart b) demonstrates a continuous, albeit slowing, upward trend in accuracy up to 5 interactions.
3. **Initial Performance:** At 0 interactions, both methods start at a similar accuracy level (~35-37%), which is only marginally better than random guessing.
4. **Variability:** The error bars for both methods are substantial, indicating significant variance in performance across different runs or samples. The overlap in error bars between consecutive points suggests the improvements, while visible in the trend, may not always be statistically distinct at each step.
### Interpretation
The data suggests that incorporating a "belief-based" mechanism into the prediction model leads to more sustained learning over multiple interactions compared to a "direct" prediction approach. While both methods improve upon a random baseline, the direct method's performance gains saturate quickly. The belief-based method's steady climb implies it may be better at accumulating knowledge or refining its internal state with each interaction, leading to better generalization on a held-out set. This is a classic pattern in machine learning where a more complex model (beliefs) can capture incremental improvements that a simpler model (direct) cannot sustain. The large error bars, however, caution that the exact performance can be noisy, and the observed trends represent average behavior. The key takeaway is that for tasks requiring sequential interactions, a belief-augmented architecture appears more promising for long-term performance gains.