## Histogram: First Correct Answer Emergence
### Overview
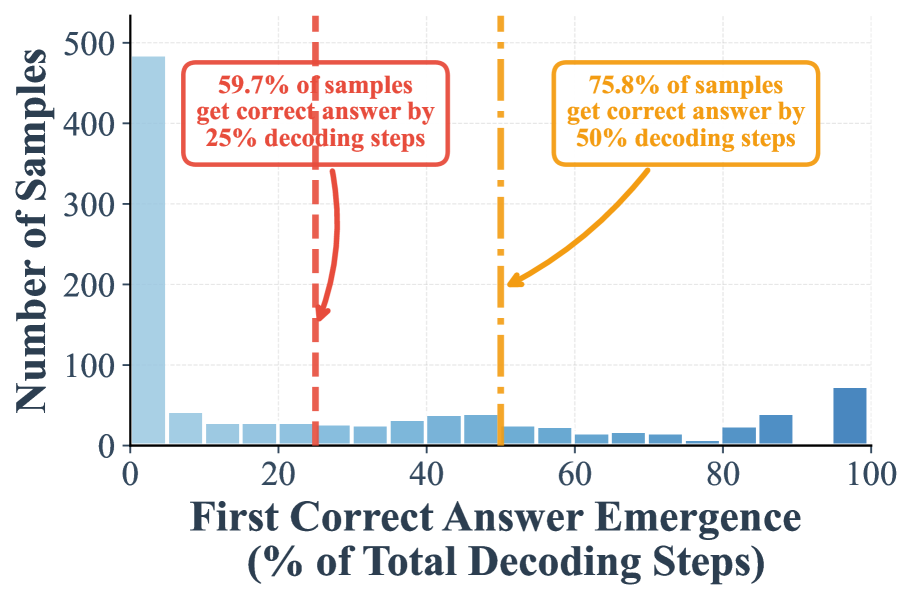
The image is a histogram showing the distribution of the "First Correct Answer Emergence" as a percentage of total decoding steps. The y-axis represents the number of samples, and the x-axis represents the percentage of total decoding steps. Two vertical dashed lines, one red and one orange, indicate specific percentages of decoding steps (25% and 50%, respectively) and are annotated with the percentage of samples that achieve a correct answer by those points.
### Components/Axes
* **Y-axis:** "Number of Samples", ranging from 0 to 500 in increments of 100.
* **X-axis:** "First Correct Answer Emergence (% of Total Decoding Steps)", ranging from 0 to 100. The x-axis appears to be divided into bins of approximately 5 units each.
* **Bars:** The histogram consists of blue bars of varying heights, representing the number of samples for each bin of "First Correct Answer Emergence".
* **Red Dashed Line:** Located at approximately 25% on the x-axis.
* **Orange Dashed Line:** Located at approximately 50% on the x-axis.
* **Annotations:**
* A red box states: "59.7% of samples get correct answer by 25% decoding steps". An arrow points from the box to the red dashed line.
* An orange box states: "75.8% of samples get correct answer by 50% decoding steps". An arrow points from the box to the orange dashed line.
### Detailed Analysis
* **Bar Heights:**
* The bar at 0% has a height of approximately 480.
* The bar at 95-100% has a height of approximately 75.
* The bars between 5% and 95% are significantly lower, generally below 40.
* **Red Dashed Line:**
* Located at 25% on the x-axis.
* The annotation indicates that 59.7% of samples get the correct answer by this point.
* **Orange Dashed Line:**
* Located at 50% on the x-axis.
* The annotation indicates that 75.8% of samples get the correct answer by this point.
### Key Observations
* A large number of samples (approximately 480) achieve the correct answer very early in the decoding process (0% decoding steps).
* The number of samples achieving the correct answer decreases significantly after 0% and remains low until the end.
* There is a slight increase in the number of samples achieving the correct answer towards the end of the decoding process (95-100%).
* 59.7% of samples get the correct answer by 25% of the decoding steps.
* 75.8% of samples get the correct answer by 50% of the decoding steps.
### Interpretation
The histogram suggests that for a significant portion of the samples, the correct answer emerges very early in the decoding process. This is indicated by the high bar at 0%. The relatively flat distribution between 5% and 95% suggests that for the remaining samples, the correct answer emerges more uniformly across this range. The annotations highlight that a substantial percentage of samples achieve the correct answer by 25% and 50% of the decoding steps, indicating the efficiency of the decoding process for a majority of the samples. The slight increase at the end suggests that some samples require nearly the entire decoding process to arrive at the correct answer.