\n
## Bar Chart: First Correct Answer Emergence
### Overview
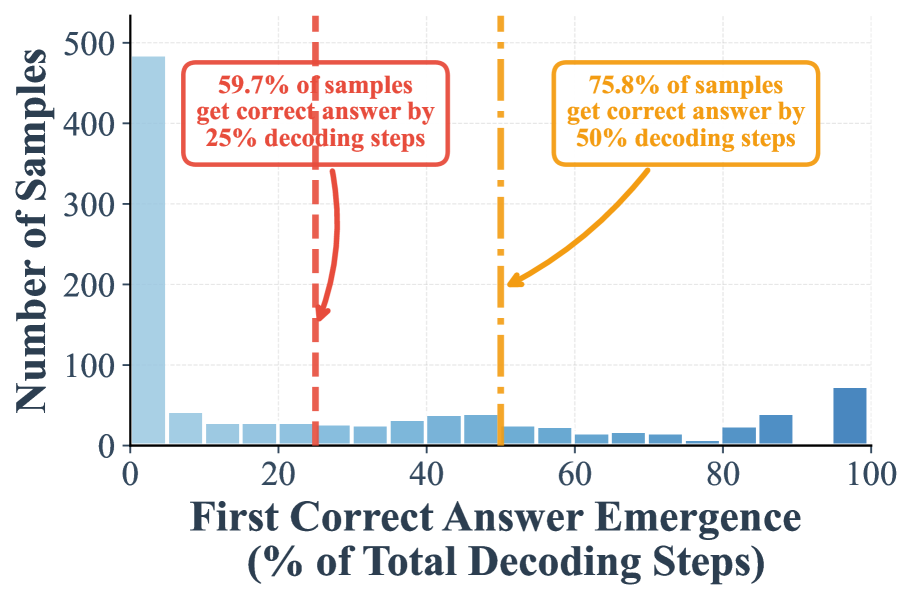
The image presents a bar chart illustrating the distribution of the percentage of total decoding steps required for the first correct answer to emerge. The chart shows the number of samples (y-axis) against the percentage of total decoding steps (x-axis). An orange line overlays the bar chart, representing the cumulative percentage of samples achieving a correct answer by a given decoding step. Two vertical dashed lines highlight specific decoding step percentages (25% and 50%) with corresponding percentages of samples achieving a correct answer.
### Components/Axes
* **X-axis Title:** "First Correct Answer Emergence (% of Total Decoding Steps)" - Scale ranges from 0 to 100, with increments of 10.
* **Y-axis Title:** "Number of Samples" - Scale ranges from 0 to 500, with increments of 100.
* **Bar Chart:** Represents the frequency distribution of the percentage of decoding steps at which the first correct answer emerges.
* **Orange Line:** Represents the cumulative percentage of samples that achieve a correct answer by a given decoding step. The line starts at approximately 0, increases gradually, and then rises more steeply.
* **Red Dashed Vertical Line:** Located at approximately 25% on the x-axis. Text annotation: "59.7% of samples get correct answer by 25% decoding steps".
* **Orange Dashed Vertical Line:** Located at approximately 50% on the x-axis. Text annotation: "75.8% of samples get correct answer by 50% decoding steps".
* **Bar Colors:** The bars are a light blue color.
### Detailed Analysis
The bar chart shows a distribution heavily skewed towards lower percentages of decoding steps.
* **0-10%:** Approximately 20 samples.
* **10-20%:** Approximately 180 samples.
* **20-30%:** Approximately 200 samples.
* **30-40%:** Approximately 60 samples.
* **40-50%:** Approximately 40 samples.
* **50-60%:** Approximately 20 samples.
* **60-70%:** Approximately 10 samples.
* **70-80%:** Approximately 10 samples.
* **80-90%:** Approximately 20 samples.
* **90-100%:** Approximately 60 samples.
The orange cumulative line starts at approximately 0 at 0% decoding steps.
* **25% Decoding Steps:** The line reaches approximately 60 samples.
* **50% Decoding Steps:** The line reaches approximately 370 samples.
* **75% Decoding Steps:** The line reaches approximately 440 samples.
* **100% Decoding Steps:** The line reaches approximately 500 samples.
The orange line shows a relatively flat slope from 0% to approximately 25% decoding steps, then a steeper slope from 25% to 50%, and a gradual slope from 50% to 100%.
### Key Observations
* The majority of samples achieve a correct answer within the first 20-30% of decoding steps.
* There is a significant drop in the number of samples requiring more than 50% of decoding steps.
* The cumulative percentage of samples achieving a correct answer increases rapidly between 25% and 50% decoding steps.
* The distribution is not uniform; it is heavily concentrated at lower decoding step percentages.
### Interpretation
The data suggests that the model is relatively efficient at generating correct answers, with a large proportion of samples converging on a correct answer within the first quarter of the decoding process. The steep increase in the cumulative percentage between 25% and 50% indicates a critical point where the model rapidly refines its output. The fact that 75.8% of samples achieve a correct answer by 50% decoding steps suggests that the model is generally reliable within this timeframe. The tail of the distribution extending to 100% decoding steps indicates that a small percentage of samples require a more extensive decoding process to arrive at a correct answer, potentially due to more complex or ambiguous inputs. This could be indicative of the model's limitations in handling certain types of data or the need for further optimization of the decoding algorithm. The annotations highlight key milestones in the decoding process, providing a clear understanding of the model's performance at different stages.