# Technical Data Extraction: MATH Test Accuracy Analysis
This document provides a comprehensive extraction of data and trends from two technical charts analyzing MATH test accuracy based on sequential/parallel processing ratios and problem difficulty.
---
## Chart 1: Varying Sequential/Parallel with Verifier
### Component Isolation
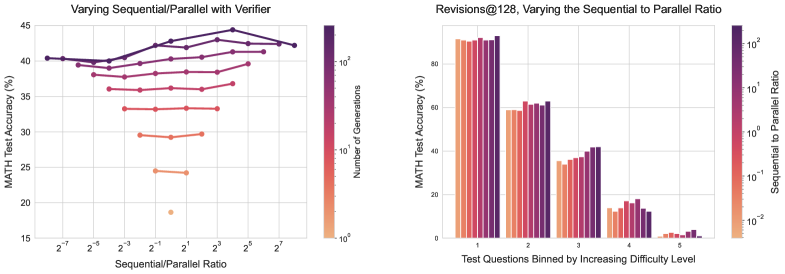
* **Header:** Title "Varying Sequential/Parallel with Verifier"
* **Main Chart:** A line graph with multiple data series plotted against a logarithmic X-axis.
* **Legend (Right Side):** A vertical color bar representing the "Number of Generations" on a log scale from $10^0$ (1) to $10^2$ (100+).
### Axis Definitions
* **Y-Axis:** "MATH Test Accuracy (%)"
* Scale: Linear, from 15 to 45 in increments of 5.
* **X-Axis:** "Sequential/Parallel Ratio"
* Scale: Logarithmic (base 2), markers at $2^{-7}, 2^{-5}, 2^{-3}, 2^{-1}, 2^1, 2^3, 2^5, 2^7$.
### Data Series and Trends
The chart contains several lines, color-coded by the number of generations. Darker purple indicates more generations; lighter orange indicates fewer.
1. **High Generation Count (Dark Purple, ~128-256 generations):**
* **Trend:** Starts at ~40% accuracy at $2^{-8}$, dips slightly, then rises to a peak of ~44% at $2^4$ before declining slightly.
* **Key Points:** Peak accuracy is achieved when the Sequential/Parallel ratio is approximately $2^4$ (16).
2. **Mid-Range Generation Count (Magenta/Pink, ~16-64 generations):**
* **Trend:** These lines are generally flatter and lower than the dark purple line. They show a slight upward trend as the ratio moves from $2^{-3}$ toward $2^3$.
* **Key Points:** Accuracy ranges between 33% and 40%.
3. **Low Generation Count (Orange/Light Peach, 1-4 generations):**
* **Trend:** These appear as short segments or single points at the bottom center of the graph.
* **Key Points:**
* Single point (1 generation) at ratio $2^0$ (1) shows ~18% accuracy.
* Short line (approx. 2-4 generations) at ratio $2^{-1}$ to $2^1$ shows ~24% accuracy.
### Summary of Findings
Accuracy increases significantly with the number of generations. For high generation counts, there is an optimal "sweet spot" for the Sequential/Parallel ratio around $2^4$, where performance is maximized.
---
## Chart 2: Revisions@128, Varying the Sequential to Parallel Ratio
### Component Isolation
* **Header:** Title "Revisions@128, Varying the Sequential to Parallel Ratio"
* **Main Chart:** A grouped bar chart showing accuracy across five difficulty levels.
* **Legend (Right Side):** A vertical color bar representing "Sequential to Parallel Ratio" on a log scale from $10^{-2}$ (0.01) to $10^2$ (100).
### Axis Definitions
* **Y-Axis:** "MATH Test Accuracy (%)"
* Scale: Linear, from 0 to 80+ in increments of 20.
* **X-Axis:** "Test Questions Binned by Increasing Difficulty Level"
* Categories: 1, 2, 3, 4, 5 (where 1 is easiest, 5 is hardest).
### Data Table Reconstruction
Each difficulty bin contains approximately 10 bars, representing different Sequential to Parallel ratios (from orange/low ratio to dark purple/high ratio).
| Difficulty Level | Trend Description | Approximate Accuracy Range |
| :--- | :--- | :--- |
| **1 (Easiest)** | Very high accuracy; relatively stable across all ratios. | ~90% - 92% |
| **2** | High accuracy; slight improvement as the ratio increases (darker bars). | ~58% - 63% |
| **3** | Moderate accuracy; clear upward trend as the ratio increases. | ~35% - 42% |
| **4** | Low accuracy; performance peaks at mid-to-high ratios then drops for the highest ratio. | ~12% - 18% |
| **5 (Hardest)** | Very low accuracy; performance is negligible for low ratios, peaking slightly for mid-high ratios. | ~1% - 4% |
### Summary of Findings
1. **Difficulty Impact:** There is a sharp, inverse correlation between question difficulty and accuracy.
2. **Ratio Impact:** Increasing the Sequential to Parallel ratio (moving toward more sequential processing) generally improves accuracy, particularly for mid-difficulty problems (Levels 2 and 3).
3. **Diminishing Returns:** For the hardest problems (Level 5), even high sequential ratios fail to bring accuracy above ~5%.