## Diagram: Grid-Based Color Matrix
### Overview
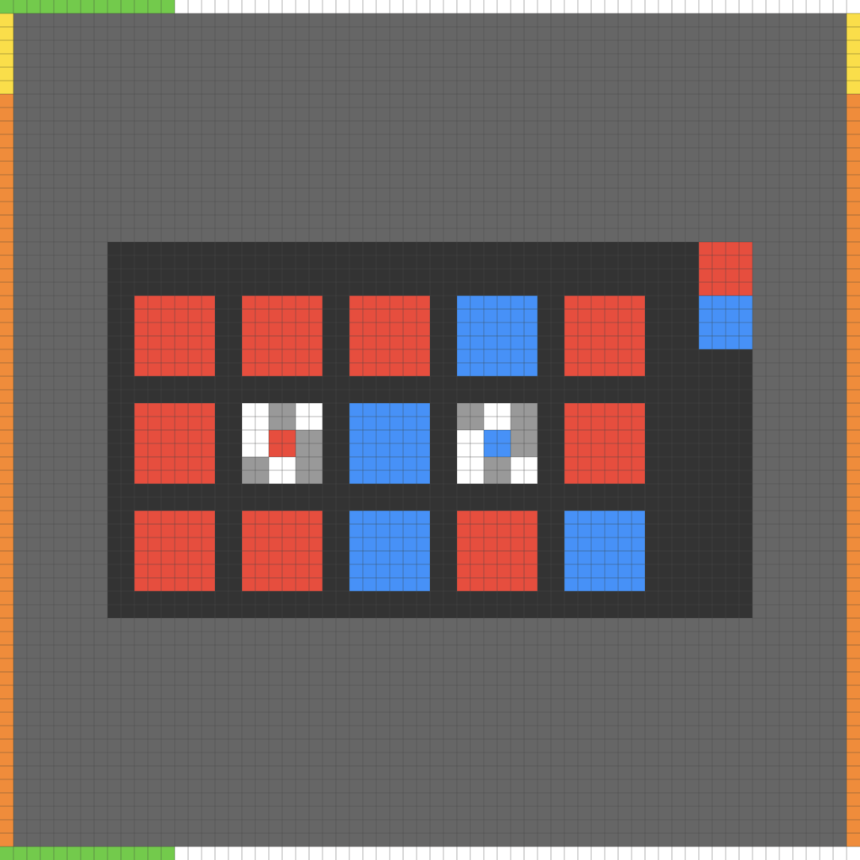
The image displays a pixel-art style diagram composed of colored squares arranged in a grid pattern on a dark gray background. The entire composition is framed by a multi-colored border. There is no textual information, labels, axes, legends, or numerical data present in the image. The information is conveyed entirely through the arrangement and color of geometric shapes.
### Components & Spatial Layout
1. **Outer Border:** A thin frame surrounds the entire image.
* **Top Edge:** The left segment is green, the right segment is yellow.
* **Bottom Edge:** The left segment is green.
* **Left Edge:** The entire vertical strip is orange.
* **Right Edge:** The entire vertical strip is orange.
2. **Background:** A uniform dark gray field with a subtle, fine grid pattern.
3. **Central Matrix (Main Component):** A darker gray rectangular area, centered within the background, containing a 3-row by 5-column grid of larger squares.
4. **Auxiliary Element:** A small 2-row by 1-column grid is positioned to the right of the main matrix, aligned with its top edge.
### Detailed Analysis: Central Matrix Content
The 3x5 grid contains squares of three distinct types. The following describes each cell, reading left-to-right, top-to-bottom.
* **Row 1 (Top):**
1. Solid red square.
2. Solid red square.
3. Solid red square.
4. Solid blue square.
5. Solid red square.
* **Row 2 (Middle):**
1. Solid red square.
2. **Patterned Square:** A 3x3 sub-grid of white squares with a gray border, containing a single red square at its center.
3. Solid blue square.
4. **Patterned Square:** A 3x3 sub-grid of white squares with a gray border, containing a single blue square at its center.
5. Solid red square.
* **Row 3 (Bottom):**
1. Solid red square.
2. Solid red square.
3. Solid blue square.
4. Solid red square.
5. Solid blue square.
**Auxiliary Element (Right of Matrix):**
* Top cell: Solid red square.
* Bottom cell: Solid blue square.
### Key Observations
* **Color Distribution:** Red is the dominant color, appearing in 10 of the 15 main grid cells and the top auxiliary cell. Blue appears in 5 main grid cells and the bottom auxiliary cell.
* **Symmetry & Pattern:** The two patterned squares in the middle row (positions 2 and 4) are symmetrically placed around the central blue square. They are identical in structure but differ in the color of their central pixel (red vs. blue).
* **Spatial Grouping:** The auxiliary red/blue pair on the right mirrors the color pairing found in the patterned squares and may serve as a key or legend, though no explicit label confirms this.
### Interpretation
This diagram appears to be an abstract representation of a system, state machine, or data matrix where color and pattern encode meaning. The lack of labels makes definitive interpretation impossible, but the structure suggests several plausible readings:
1. **State or Category Map:** Each square could represent a node, cell, or data point. Red and blue might signify two primary states (e.g., active/inactive, type A/type B). The patterned squares could represent composite states, decision points, or cells undergoing a transformation.
2. **Game Board or Puzzle:** The layout resembles a board for a logic puzzle or simple game, where the goal might involve matching colors or navigating between the patterned "special" cells.
3. **Visual Algorithm or Process Flow:** The arrangement could depict the steps or data flow in a process. The central row, with its unique patterned cells, might represent a processing or comparison stage between the more uniform top and bottom rows.
4. **Encoded Data:** The grid might be a direct visual encoding of a small dataset, where color represents a binary or categorical value for each position.
**Notable Anomaly:** The two patterned squares are the only complex elements. Their internal structure (a colored center within a white/gray field) sets them apart as potentially significant—perhaps as inputs, outputs, or operators within the system the diagram represents. The auxiliary red/blue pair strongly reinforces the idea that these two colors are the fundamental variables of the system.
**Conclusion:** The diagram conveys information through spatial relationship and color contrast. Its meaning is entirely dependent on external context not provided in the image. To be useful, it would require a accompanying legend or textual description defining what the red/blue colors and the specific pattern signify.