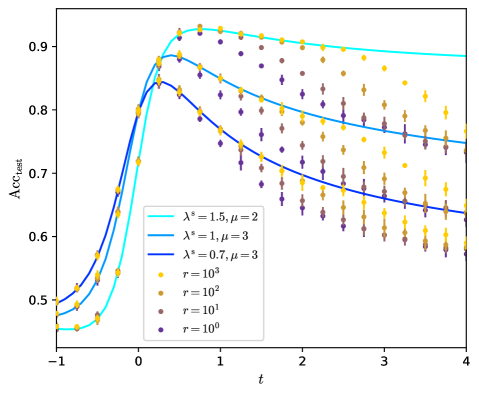
## Line Chart: Test Accuracy Over Time
### Overview
The chart displays three parametric curves representing test accuracy (Acc_test) over time (t), with embedded data points for different system configurations. Each curve is associated with specific parameter combinations (λ*, μ), while data points are color-coded by a variable 'r' (10³ to 10⁰). The chart shows dynamic behavior with sharp transitions and asymptotic trends.
### Components/Axes
- **X-axis (t)**: Time parameter, linear scale from -1 to 4
- **Y-axis (Acc_test)**: Test accuracy metric, linear scale from 0.5 to 0.9
- **Legend**:
- **Lines**:
- Cyan: λ* = 1.5, μ = 2
- Blue: λ* = 1, μ = 3
- Dark Blue: λ* = 0.7, μ = 3
- **Markers**:
- Yellow: r = 10³
- Brown: r = 10²
- Purple: r = 10¹
- Dark Purple: r = 10⁰
### Detailed Analysis
1. **Cyan Line (λ*=1.5, μ=2)**:
- Sharp ascent from t=-1 (0.48) to peak at t=0.5 (0.92)
- Asymptotic approach to 0.9 as t→4
- Data points (yellow) show 0.88-0.92 range post-peak
2. **Blue Line (λ*=1, μ=3)**:
- Gradual rise to t=0.3 peak (0.88)
- Steeper decline post-peak compared to cyan line
- Data points (yellow) maintain 0.82-0.88 range
3. **Dark Blue Line (λ*=0.7, μ=3)**:
- Slowest rise with delayed peak at t=1.2 (0.80)
- Gradual decline to 0.68 by t=4
- Data points (yellow) show 0.75-0.80 range
4. **r-Value Trends**:
- Higher r (yellow) consistently shows higher Acc_test
- r=10³ (yellow) maintains 0.88-0.92 range
- r=10⁰ (dark purple) shows 0.58-0.62 range
- All r-values follow identical parametric curves but with vertical offsets
### Key Observations
- Parameter combinations (λ*, μ) dictate curve shape more than r-values
- r-values act as vertical offsets rather than modifying curve dynamics
- All curves exhibit sigmoidal behavior with parameter-dependent inflection points
- r=10³ (yellow) maintains highest performance across all t values
- λ* inversely correlates with peak time (higher λ* → earlier peak)
### Interpretation
The chart demonstrates how system parameters (λ*, μ) and configuration scale (r) jointly influence test accuracy trajectories. The cyan line (high λ*, low μ) shows optimal early performance but plateaus faster, while the dark blue line (low λ*, high μ) exhibits delayed but sustained performance. The r-values represent system scale factors that uniformly shift accuracy levels without altering temporal dynamics. This suggests parameter optimization should prioritize λ* and μ tuning, while r-scaling provides predictable accuracy offsets. The consistent vertical offset between r-values implies linear scaling relationships in the underlying model.