## Bar Chart: Process Error Rate by Benchmark
### Overview
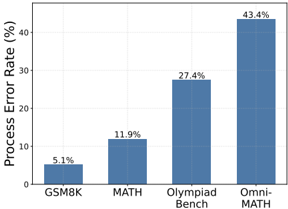
The image is a vertical bar chart illustrating the "Process Error Rate (%)" across four distinct mathematical reasoning benchmarks. The chart demonstrates a clear, progressive increase in error rates as the benchmarks move from standard grade-school level problems to advanced competition-level mathematics.
### Components/Axes
* **Y-Axis:** Labeled "Process Error Rate (%)". The scale ranges from 0 to 40+, with horizontal grid lines marking increments of 10.
* **X-Axis:** Categorical axis containing four labels, positioned from left to right: "GSM8K", "MATH", "Olympiad Bench", and "Omni-MATH".
* **Data Series:** Four vertical blue bars, each corresponding to one of the X-axis categories. Each bar is topped with a text label indicating the exact percentage value.
### Detailed Analysis
The chart displays a consistent upward trend in error rates from left to right. The data points are as follows:
* **GSM8K:** The leftmost bar, representing the lowest error rate.
* **Value:** 5.1%
* **MATH:** The second bar from the left.
* **Value:** 11.9%
* **Olympiad Bench:** The third bar from the left.
* **Value:** 27.4%
* **Omni-MATH:** The rightmost bar, representing the highest error rate.
* **Value:** 43.4%
### Key Observations
* **Significant Variance:** There is a substantial disparity between the lowest and highest error rates. The error rate for "Omni-MATH" (43.4%) is approximately 8.5 times higher than that of "GSM8K" (5.1%).
* **Non-Linear Growth:** The increase in error rate is not linear. The absolute increase between "Olympiad Bench" and "Omni-MATH" (16 percentage points) is significantly larger than the increase between "GSM8K" and "MATH" (6.8 percentage points).
* **Difficulty Hierarchy:** The visual progression strongly implies a hierarchy of task difficulty, where the benchmarks are ordered by increasing complexity.
### Interpretation
* **What the data demonstrates:** This chart serves as a performance metric for an AI model (or models) on mathematical reasoning tasks. It quantifies the "Process Error Rate," which likely refers to the frequency with which the model fails to generate a correct logical path or solution steps.
* **Why it matters:** The data highlights the "difficulty gap" in current AI reasoning capabilities. While models perform relatively well on standard datasets like GSM8K, their performance degrades significantly as they encounter more abstract and complex mathematical problems found in "Olympiad Bench" and "Omni-MATH."
* **Reading between the lines:** The high error rate on "Omni-MATH" suggests that the model's reasoning process is fragile when faced with advanced, multi-step, or highly abstract mathematical challenges. This chart is likely used in a research context to justify the need for more robust reasoning architectures or to highlight the limitations of current state-of-the-art models in high-level mathematical domains.