## Horizontal Bar Chart: Task Success Rate by Model Combination
### Overview
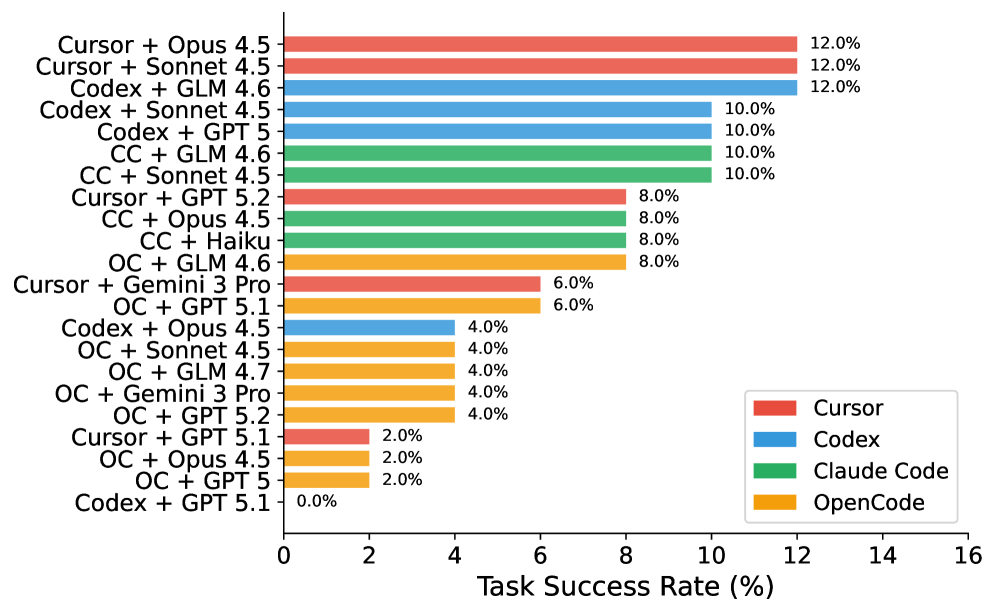
The image is a horizontal bar chart comparing the task success rates of different model combinations. The x-axis represents the task success rate in percentage, ranging from 0% to 16%. The y-axis lists the various model combinations. The bars are color-coded to represent different base models: Cursor (red), Codex (blue), Claude Code (green), and OpenCode (orange).
### Components/Axes
* **X-axis:** Task Success Rate (%), ranging from 0 to 16 with increments of 2.
* **Y-axis:** Model Combinations (listed vertically).
* **Legend:** Located in the bottom-right corner, mapping colors to base models:
* Red: Cursor
* Blue: Codex
* Green: Claude Code
* Orange: OpenCode
### Detailed Analysis
Here's a breakdown of the task success rates for each model combination, along with their corresponding colors:
* **Cursor + Opus 4.5:** 12.0% (Red) - Highest success rate for Cursor.
* **Cursor + Sonnet 4.5:** 12.0% (Red) - Highest success rate for Cursor.
* **Codex + GLM 4.6:** 12.0% (Blue) - Highest success rate for Codex.
* **Codex + Sonnet 4.5:** 10.0% (Blue)
* **Codex + GPT 5:** 10.0% (Blue)
* **CC + GLM 4.6:** 10.0% (Green) - Highest success rate for Claude Code.
* **CC + Sonnet 4.5:** 10.0% (Green)
* **Cursor + GPT 5.2:** 8.0% (Red)
* **CC + Opus 4.5:** 8.0% (Green)
* **CC + Haiku:** 8.0% (Green)
* **OC + GLM 4.6:** 8.0% (Orange) - Highest success rate for OpenCode.
* **Cursor + Gemini 3 Pro:** 6.0% (Red)
* **OC + GPT 5.1:** 6.0% (Orange)
* **Codex + Opus 4.5:** 4.0% (Blue)
* **OC + Sonnet 4.5:** 4.0% (Orange)
* **OC + GLM 4.7:** 4.0% (Orange)
* **OC + Gemini 3 Pro:** 4.0% (Orange)
* **OC + GPT 5.2:** 4.0% (Orange)
* **Cursor + GPT 5.1:** 2.0% (Red)
* **OC + Opus 4.5:** 2.0% (Orange)
* **OC + GPT 5:** 2.0% (Orange)
* **Codex + GPT 5.1:** 0.0% (Blue) - Lowest success rate.
### Key Observations
* The highest success rates are achieved by Cursor, Codex, and Claude Code when combined with specific models (Opus 4.5, Sonnet 4.5, and GLM 4.6 respectively).
* Codex + GPT 5.1 has the lowest success rate (0.0%).
* OpenCode generally has lower success rates compared to the other base models.
### Interpretation
The chart illustrates the performance of different model combinations in terms of task success rate. The data suggests that the choice of model combination significantly impacts performance. Certain combinations, such as Cursor + Opus 4.5 and Codex + GLM 4.6, yield significantly higher success rates compared to others. The relatively lower performance of OpenCode across various combinations suggests it may be less effective in these specific tasks or requires further optimization. The 0% success rate for Codex + GPT 5.1 is a notable outlier, indicating a potential incompatibility or issue with this particular combination.