## Line Chart: Eviction-based KV On LongBench
### Overview
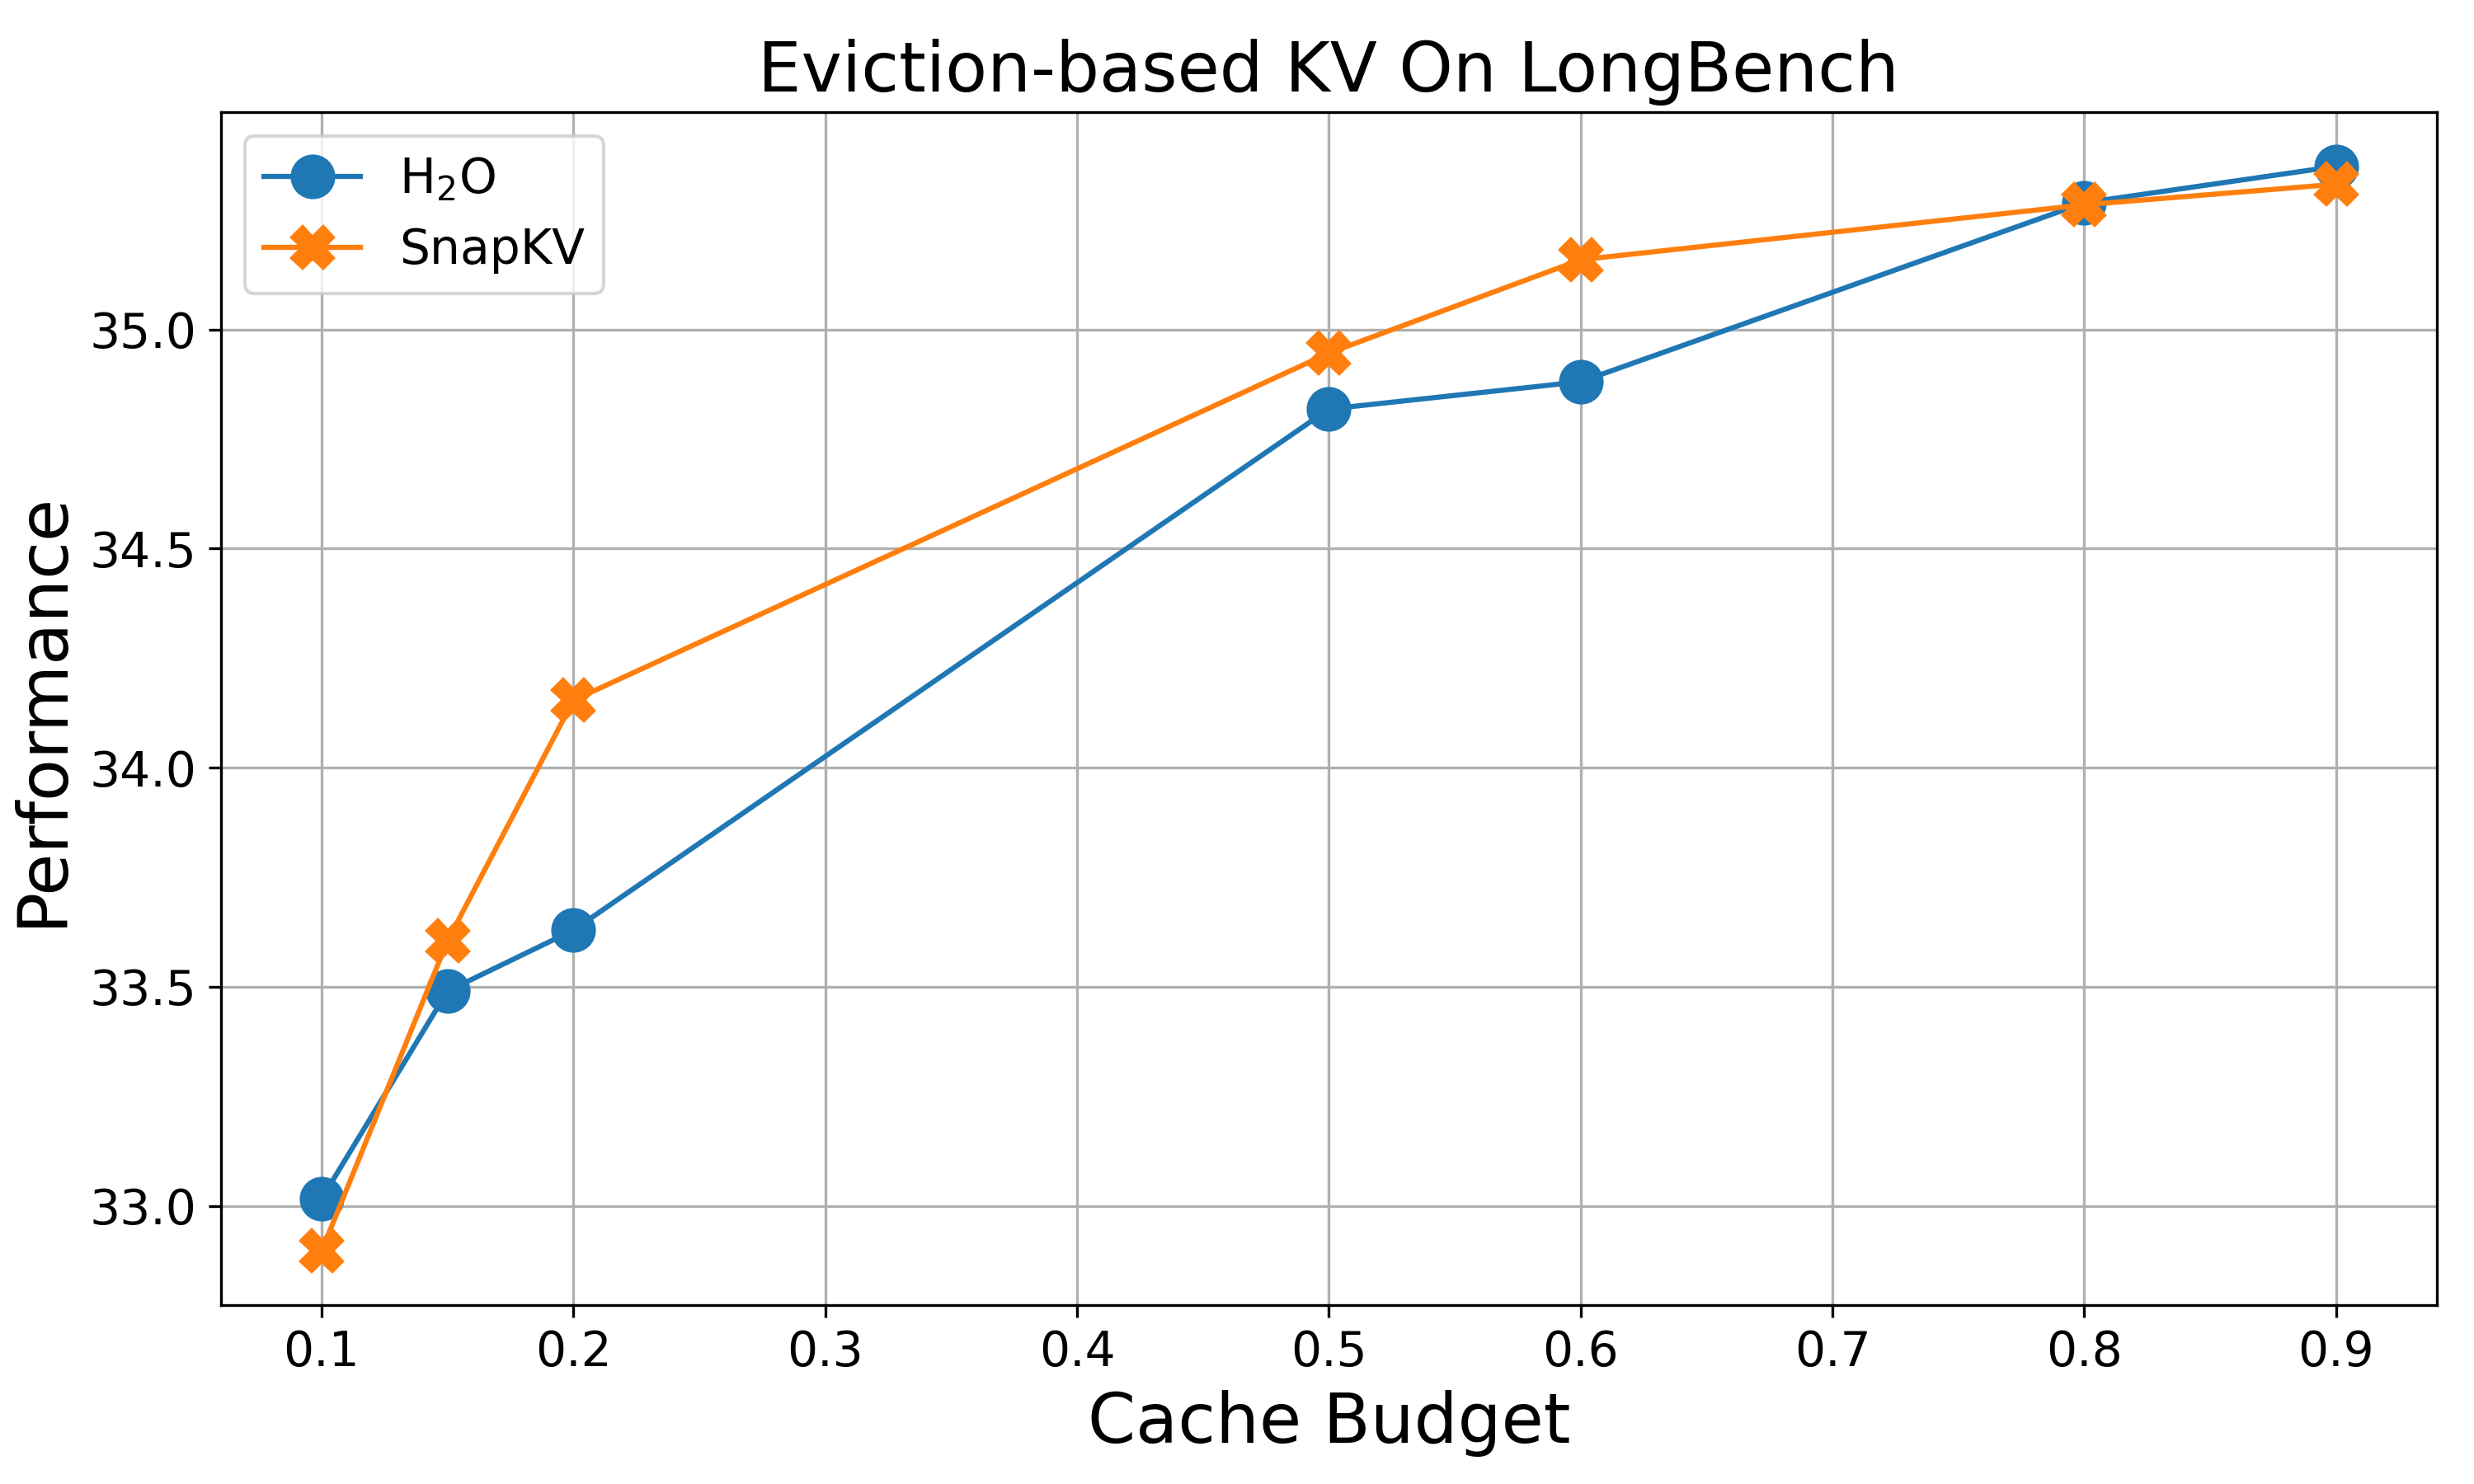
The chart compares the performance of two key-value (KV) eviction strategies, **H2O** and **SnapKV**, across varying cache budgets on the LongBench benchmark. Performance is measured on a scale from 33.0 to 35.5, with cache budgets ranging from 0.1 to 0.9.
---
### Components/Axes
- **X-axis (Cache Budget)**: Labeled "Cache Budget," with tick marks at 0.1, 0.2, 0.3, 0.5, 0.6, 0.8, and 0.9.
- **Y-axis (Performance)**: Labeled "Performance," with tick marks at 33.0, 33.5, 34.0, 34.5, 35.0, 35.5.
- **Legend**: Located in the top-left corner, with:
- **Blue circles** representing **H2O**.
- **Orange crosses** representing **SnapKV**.
---
### Detailed Analysis
#### H2O (Blue Circles)
- **Trend**: Starts at **33.0** (cache budget 0.1) and increases steadily, reaching **35.8** at 0.9.
- **Key Data Points**:
- 0.1 → 33.0
- 0.2 → 33.6
- 0.3 → 34.0
- 0.5 → 34.8
- 0.6 → 34.9
- 0.8 → 35.7
- 0.9 → 35.8
#### SnapKV (Orange Crosses)
- **Trend**: Begins at **32.9** (cache budget 0.1) and rises sharply, plateauing near **35.8** at 0.9.
- **Key Data Points**:
- 0.1 → 32.9
- 0.2 → 34.2
- 0.3 → 34.4
- 0.5 → 34.9
- 0.6 → 35.2
- 0.8 → 35.7
- 0.9 → 35.8
---
### Key Observations
1. **Performance Convergence**: Both methods converge at **35.8** at a cache budget of 0.9.
2. **H2O Advantage at High Budgets**: H2O outperforms SnapKV at cache budgets ≥0.5.
3. **SnapKV Early Lead**: SnapKV starts stronger at lower budgets (e.g., 34.2 vs. 33.6 at 0.2).
4. **Steady Growth**: Both lines show consistent upward trends, with no plateaus or declines.
---
### Interpretation
- **Efficiency Trade-off**: H2O becomes more efficient than SnapKV as cache budget increases, suggesting better scalability for larger workloads.
- **SnapKV’s Early Performance**: SnapKV may be optimized for low-resource environments but loses ground as resources expand.
- **Benchmark Context**: The LongBench results imply that eviction strategy choice depends heavily on available cache resources.
No anomalies or outliers are observed. The data aligns with the legend and axis labels, confirming accuracy.