\n
## Line Chart: AI Model Success Rate vs. Problem Size
### Overview
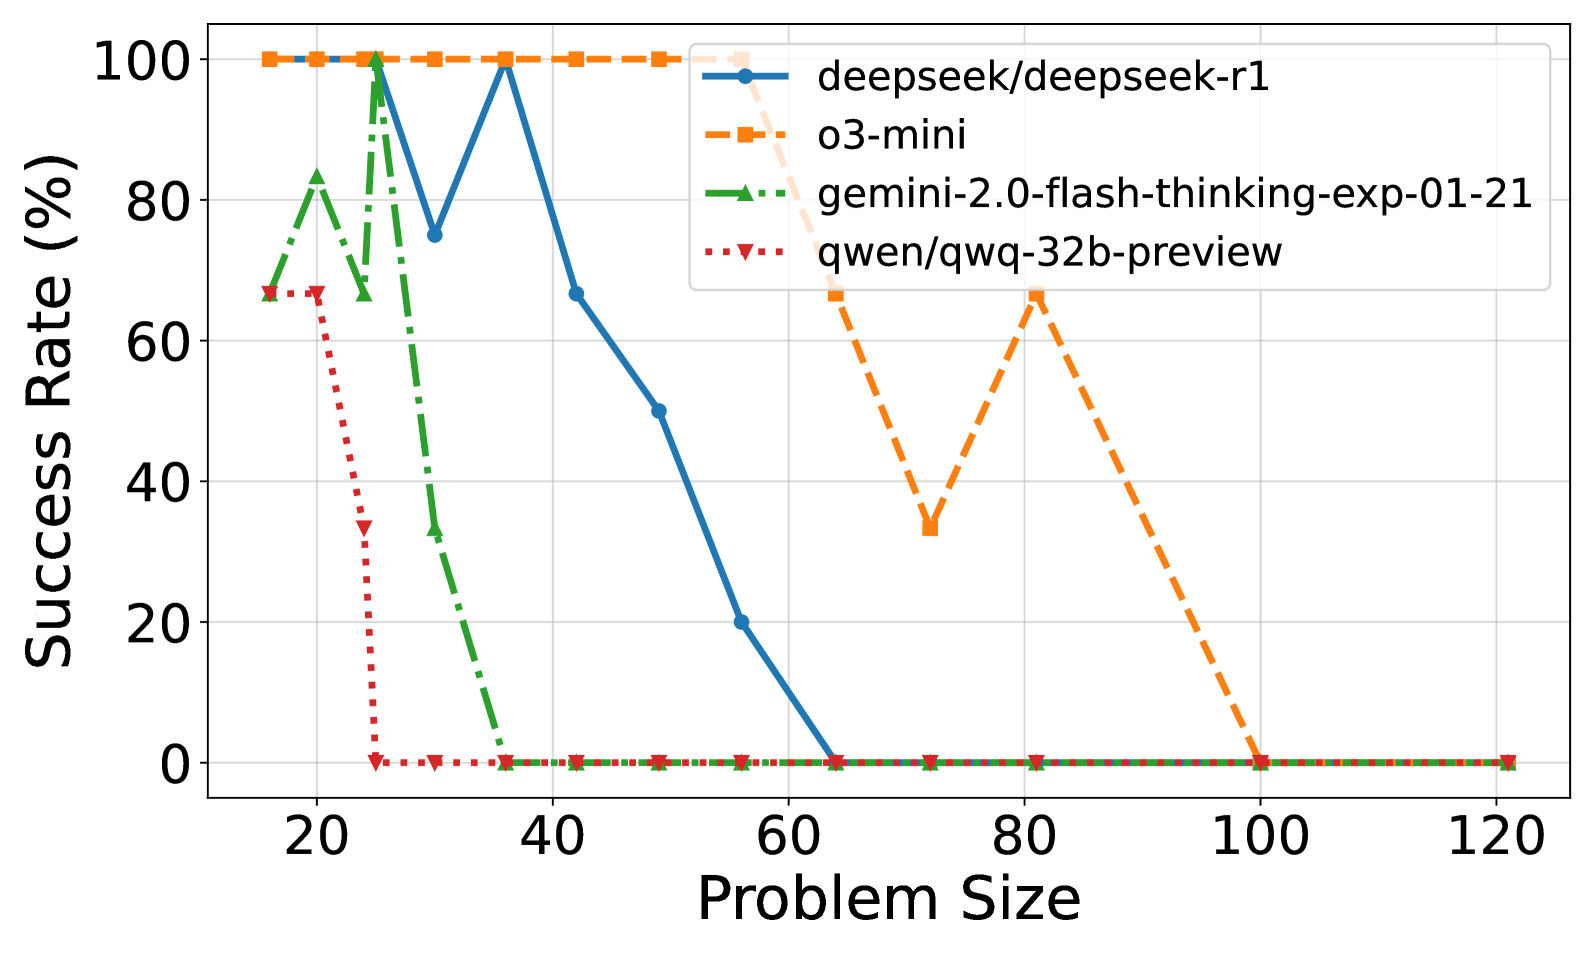
This is a line chart comparing the performance of four different AI models as the complexity of a task (represented by "Problem Size") increases. The chart plots "Success Rate (%)" on the vertical axis against "Problem Size" on the horizontal axis. The data suggests a general trend where model performance degrades as problem size grows, but the rate and pattern of degradation vary significantly between models.
### Components/Axes
* **X-Axis (Horizontal):** Labeled "Problem Size". The scale runs from approximately 15 to 120, with major tick marks at 20, 40, 60, 80, 100, and 120.
* **Y-Axis (Vertical):** Labeled "Success Rate (%)". The scale runs from 0 to 100, with major tick marks at 0, 20, 40, 60, 80, and 100.
* **Legend:** Located in the top-right quadrant of the chart area. It identifies four data series:
1. `deepseek/deepseek-r1`: Represented by a solid blue line with circular markers.
2. `o3-mini`: Represented by a dashed orange line with square markers.
3. `gemini-2.0-flash-thinking-exp-01-21`: Represented by a dash-dot green line with upward-pointing triangle markers.
4. `qwen/qwq-32b-preview`: Represented by a dotted red line with downward-pointing triangle markers.
### Detailed Analysis
**Data Series Trends and Approximate Points:**
1. **`deepseek/deepseek-r1` (Blue, Solid Line, Circles):**
* **Trend:** Starts at 100% success, maintains it briefly, then experiences a volatile decline with sharp drops and partial recoveries before ultimately falling to 0%.
* **Approximate Data Points:**
* Problem Size ~15: 100%
* Problem Size ~25: Drops sharply to ~75%
* Problem Size ~35: Recovers to 100%
* Problem Size ~42: Drops to ~67%
* Problem Size ~50: Drops to ~50%
* Problem Size ~57: Drops to ~20%
* Problem Size ~64 and beyond: 0%
2. **`o3-mini` (Orange, Dashed Line, Squares):**
* **Trend:** Maintains a perfect 100% success rate for the longest duration, then experiences a dramatic, non-linear collapse with a significant mid-drop recovery before finally failing completely.
* **Approximate Data Points:**
* Problem Size ~15 to ~57: Consistently 100%
* Problem Size ~64: Drops to ~67%
* Problem Size ~71: Drops further to ~33%
* Problem Size ~81: Recovers sharply to ~67%
* Problem Size ~100 and beyond: 0%
3. **`gemini-2.0-flash-thinking-exp-01-21` (Green, Dash-Dot Line, Up-Triangles):**
* **Trend:** Shows high initial volatility with a peak, followed by a very rapid and steep decline to 0%.
* **Approximate Data Points:**
* Problem Size ~15: ~67%
* Problem Size ~20: Peaks at ~83%
* Problem Size ~25: Drops to ~67%
* Problem Size ~30: Plummets to ~33%
* Problem Size ~35 and beyond: 0%
4. **`qwen/qwq-32b-preview` (Red, Dotted Line, Down-Triangles):**
* **Trend:** Begins with moderate success, then suffers the most immediate and catastrophic drop to 0%.
* **Approximate Data Points:**
* Problem Size ~15: ~67%
* Problem Size ~20: ~67%
* Problem Size ~25: Drops sharply to ~33%
* Problem Size ~30 and beyond: 0%
**Spatial Grounding & Cross-Reference:**
* The legend is positioned in the top-right, overlapping the grid lines but not obscuring critical data points.
* All line colors and marker styles in the plot area correspond exactly to their definitions in the legend.
* At Problem Size ~15, the blue (`deepseek-r1`) and orange (`o3-mini`) lines both start at 100%, while the green (`gemini`) and red (`qwen`) lines start at the same point (~67%), creating two distinct starting clusters.
* All four lines converge at 0% success rate from Problem Size ~100 onward.
### Key Observations
1. **Performance Hierarchy by Robustness:** `o3-mini` is the most robust, maintaining 100% success up to a problem size of ~57. `deepseek-r1` is next, showing resilience with recoveries until ~57. `gemini` and `qwen` are significantly less robust to increasing problem size.
2. **Pattern of Failure:** The models exhibit two distinct failure patterns: a gradual, stepped decline (`deepseek-r1`, `o3-mini`) and a rapid, near-vertical collapse (`gemini`, `qwen`).
3. **Anomalous Recovery:** The `o3-mini` model shows a notable recovery at problem size ~81 after a significant drop, which is unique among the models plotted.
4. **Convergence to Zero:** All models ultimately fail (0% success rate) for problem sizes of 100 and above, suggesting a common upper limit of capability for this specific task.
### Interpretation
This chart likely benchmarks the reasoning or problem-solving capability of different large language models (LLMs) or AI agents on tasks of varying complexity (e.g., mathematical puzzles, code generation length, logical reasoning steps).
* **What the data suggests:** The data demonstrates that model performance is not linearly related to problem complexity. There appear to be critical thresholds where capability breaks down. The `o3-mini` model's performance profile suggests it may have a more robust underlying architecture or training for this specific task type, allowing it to handle larger problems before failing. The volatile performance of `deepseek-r1` could indicate sensitivity to specific problem characteristics at certain sizes.
* **How elements relate:** The "Problem Size" is the independent variable driving the change in the dependent variable, "Success Rate." The diverging lines illustrate that different models have different scaling laws and failure modes. The legend is crucial for attributing these distinct behaviors to specific model architectures or versions.
* **Notable implications:** For practical applications, this chart implies that choosing a model depends heavily on the expected problem size. `o3-mini` would be preferred for larger, more complex tasks within its operational range. The complete failure of all models at the high end (size 100+) indicates a current frontier in AI capability for this particular benchmark. The sharp drop-offs warn that a model's performance on small problems is not a reliable indicator of its performance on large ones.