\n
## Diagram: Reasoning Steps Model
### Overview
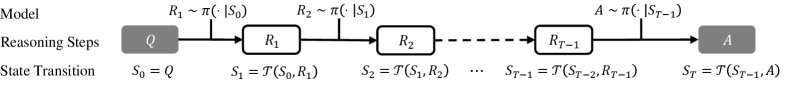
The image depicts a diagram illustrating a model of reasoning steps, showing a sequence of reasoning stages from an initial question (Q) to an answer (A). The diagram uses boxes to represent reasoning steps (R1 to RT-1) and arrows to indicate the flow of reasoning. Below the diagram, a corresponding state transition sequence is provided.
### Components/Axes
The diagram consists of the following components:
* **Q:** Initial Question (Dark Gray Rectangle, positioned at the far left)
* **R1 to RT-1:** Reasoning Steps (Rectangular Boxes, arranged horizontally in a sequence)
* **A:** Answer (Dark Gray Rectangle, positioned at the far right)
* **Arrows:** Indicate the flow of reasoning from Q to R1, then from R1 to R2, and so on, until reaching A.
* **State Transition:** A sequence of equations describing the state changes at each step.
### Detailed Analysis or Content Details
The diagram shows a sequential process. The state transition equations below the diagram detail the process:
* **S0 = Q:** The initial state is the question Q.
* **S1 = T(S0, R1):** The first state transition occurs from the initial question S0 to S1, influenced by the first reasoning step R1, using a function T.
* **S2 = T(S1, R2):** The second state transition occurs from S1 to S2, influenced by the second reasoning step R2, using the same function T.
* **...** This pattern continues for intermediate reasoning steps.
* **ST-1 = T(ST-2, RT-1):** The (T-1)th state transition occurs from ST-2 to ST-1, influenced by the (T-1)th reasoning step RT-1, using the function T.
* **ST = T(ST-1, A):** The final state transition occurs from ST-1 to ST, influenced by the answer A, using the function T.
Above the boxes, the following equations are present:
* **R1 ~ π(S0):** R1 is sampled from a distribution π conditioned on S0.
* **R2 ~ π(S1):** R2 is sampled from a distribution π conditioned on S1.
* **...** This pattern continues for intermediate reasoning steps.
* **AT ~ π(ST-1):** A is sampled from a distribution π conditioned on ST-1.
### Key Observations
The diagram illustrates a Markovian process where each reasoning step depends only on the previous state. The use of the symbol "~" indicates a probabilistic sampling process. The function "T" represents a state transition function, which is not further defined in the diagram. The diagram emphasizes the sequential nature of reasoning, where each step builds upon the previous one.
### Interpretation
This diagram represents a model of reasoning as a series of state transitions. The initial question (Q) is the starting point, and each reasoning step (R1, R2, ..., RT-1) modifies the current state based on a probabilistic distribution (π). The final state (A) represents the answer. The function T encapsulates the process of updating the state based on the reasoning step. This model suggests that reasoning can be formalized as a sequence of probabilistic state transitions, where each step refines the understanding of the problem until an answer is reached. The diagram is abstract and doesn't specify the nature of the reasoning steps or the state representation, but it provides a general framework for modeling reasoning processes. The use of probabilistic sampling suggests that reasoning is not deterministic and involves uncertainty.