## Diagram: Sequential Reasoning Process with State Transitions
### Overview
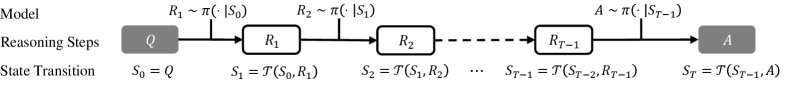
The image displays a technical flowchart illustrating a sequential reasoning process. It depicts a model that progresses through a series of discrete reasoning steps, transitioning from an initial query to a final answer. The diagram is structured in three horizontal rows: a header row with labels, a central flowchart row, and a footer row with corresponding state transition equations.
### Components/Axes
The diagram is organized into three distinct rows:
1. **Header Row (Top):**
* **Left Label:** "Model"
* **Center Label:** "Reasoning Steps"
* **Right Label:** "A" (This appears to be a label for the final output box, not a separate header).
2. **Main Flowchart Row (Center):**
* **Components:** A sequence of rectangular boxes connected by right-pointing arrows.
* **Box Labels (from left to right):**
* `Q` (Initial Query, shaded gray)
* `R₁` (First Reasoning Step)
* `R₂` (Second Reasoning Step)
* `...` (Ellipsis indicating intermediate steps)
* `R_{T-1}` (Penultimate Reasoning Step)
* `A` (Final Answer, shaded gray)
* **Arrow Annotations:** Above each arrow connecting the boxes, there is a mathematical expression describing the action taken at that step.
* Above arrow from `Q` to `R₁`: `R₁ ~ π(·|S₀)`
* Above arrow from `R₁` to `R₂`: `R₂ ~ π(·|S₁)`
* Above arrow from `R_{T-1}` to `A`: `A ~ π(·|S_{T-1})`
3. **Footer Row (Bottom):**
* **Left Label:** "State Transition"
* **Equations (aligned below each box in the main row):**
* Below `Q`: `S₀ = Q`
* Below `R₁`: `S₁ = T(S₀, R₁)`
* Below `R₂`: `S₂ = T(S₁, R₂)`
* Below `...`: `...`
* Below `R_{T-1}`: `S_{T-1} = T(S_{T-2}, R_{T-1})`
* Below `A`: `S_T = T(S_{T-1}, A)`
### Detailed Analysis
The diagram formalizes a step-by-step reasoning or decision-making process:
1. **Initialization:** The process begins with an initial state `S₀`, which is defined as the input query `Q`.
2. **Iterative Reasoning:** For each step `t` from 1 to `T-1`:
* A reasoning action `R_t` is sampled from a policy `π` conditioned on the current state `S_{t-1}`. This is denoted as `R_t ~ π(·|S_{t-1})`.
* The state is then updated via a transition function `T` using the previous state and the chosen action: `S_t = T(S_{t-1}, R_t)`.
3. **Termination:** The process concludes when a final action, the answer `A`, is sampled from the policy conditioned on the penultimate state: `A ~ π(·|S_{T-1})`.
4. **Final State:** The terminal state `S_T` is computed by applying the transition function to the penultimate state and the final answer: `S_T = T(S_{T-1}, A)`.
The flow is strictly linear and sequential, moving from left to right. The ellipsis (`...`) indicates that the number of intermediate reasoning steps (`R₂` through `R_{T-2}`) is variable.
### Key Observations
* **Dual Notation:** The process is described using two parallel notations: a visual flowchart of actions (`Q -> R₁ -> R₂ -> ... -> A`) and a formal mathematical sequence of state updates (`S₀ -> S₁ -> S₂ -> ... -> S_T`).
* **Policy-Driven Actions:** Each action (reasoning step `R_t` or final answer `A`) is generated stochastically (`~`) from a policy distribution `π`, which depends on the current state.
* **State as Memory:** The state `S_t` encapsulates all information necessary for the next decision, acting as the process's memory. It is updated deterministically by the function `T`.
* **Symmetry of Final Step:** The final answer `A` is treated analogously to a reasoning step `R_t` in the policy sampling (`A ~ π(·|S_{T-1})`), but it also triggers the final state update to `S_T`.
### Interpretation
This diagram models a **sequential decision-making or reasoning framework**, common in fields like reinforcement learning, planning, and advanced AI reasoning systems.
* **What it represents:** It illustrates how an AI agent (the "Model") can break down a complex query (`Q`) into a series of intermediate reasoning steps (`R₁, R₂, ...`) before producing a final answer (`A`). Each step refines the agent's understanding (the state `S`).
* **Relationship between elements:** The "Reasoning Steps" row shows the *observable actions*, while the "State Transition" row shows the *underlying, evolving context or belief state* that drives those actions. The policy `π` is the core "brain" that decides what to do next based on the current context.
* **Underlying logic:** The framework suggests that good answers (`A`) are not produced in a single leap but are the culmination of a deliberate, iterative process of information gathering or logical deduction (`R₁, R₂, ...`). The state `S` ensures continuity and coherence throughout this process.
* **Notable abstraction:** The diagram is highly abstract. The functions `T` (transition) and `π` (policy) are not defined, making this a general template applicable to various specific algorithms (e.g., Chain-of-Thought reasoning, Monte Carlo Tree Search, or a recurrent neural network processing a sequence). The use of `~` implies a probabilistic or sampling-based approach, rather than purely deterministic logic.