## Diagram: Diabetes Risk Factor Pathway
### Overview
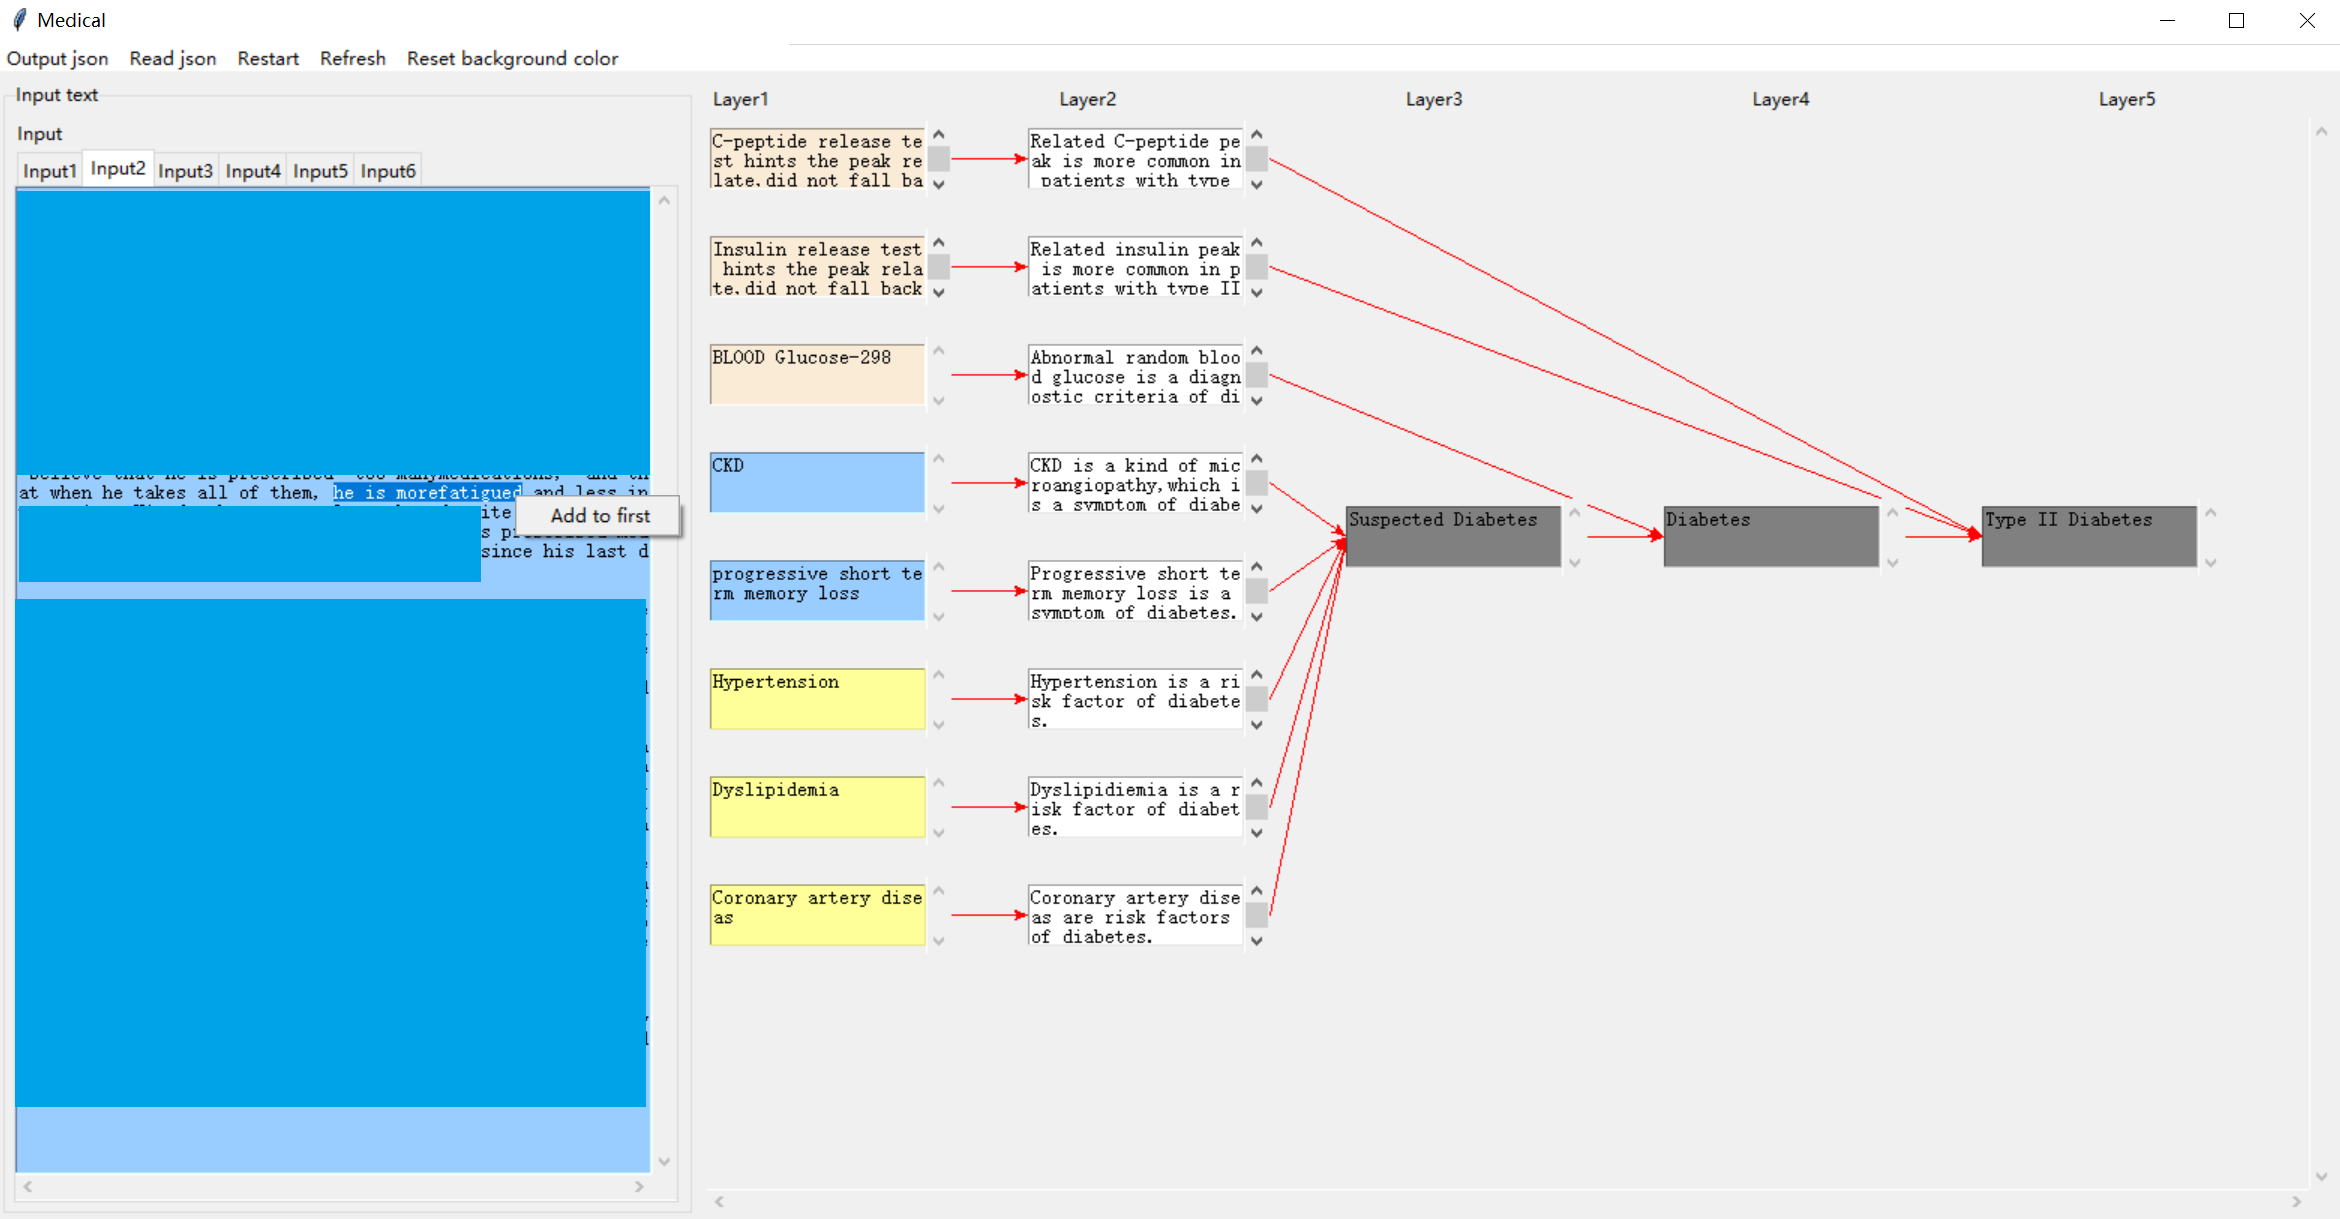
The image depicts a diagram illustrating potential pathways and risk factors leading to a diagnosis of Type II Diabetes. The diagram is structured as a multi-layered flow chart, starting with initial inputs (Layer 1) and progressing through intermediate stages (Layers 2-4) to the final diagnosis (Layer 5). The diagram is presented within a software interface, labeled "Medical" at the top-left corner, with menu options like "Output.json", "Read json", "Restart", "Reset background color", and "Input" tabs visible.
### Components/Axes
The diagram is organized into five vertical layers, labeled "Layer1" through "Layer5" at the top. Arrows indicate the flow of information or progression from one stage to the next. The diagram includes the following risk factors/conditions:
* **Layer 1 (Inputs):**
* C-peptide release test hints the peak release did not fall back
* Insulin release test hints the peak release did not fall back
* Blood Glucose=298
* CKD
* Progressive short term memory loss
* Hypertension
* Dyslipidemia
* Coronary artery disease
* **Layer 2 (Intermediate):**
* Related C-peptide peak is more common in patients with type II
* Related insulin peak is more common in patients with type II
* Abnormal random blood glucose is a diagnostic criteria of diabetes
* CKD is a kind of microangiopathy, which is a symptom of diabetes
* Progressive short term memory loss is a symptom of diabetes
* Hypertension is a risk factor of diabetes
* Dyslipidemia is a risk factor of diabetes
* Coronary artery disease are risk factors of diabetes
* **Layer 3:**
* Suspected Diabetes
* **Layer 4:**
* Diabetes
* **Layer 5:**
* Type II Diabetes
There is also a block of text on the left side of the diagram, partially obscured, containing the phrase "at when he takes all of them, and less in site. Add to first since his last d".
### Detailed Analysis or Content Details
The diagram illustrates a network of potential indicators and risk factors that can lead to a diagnosis of Type II Diabetes.
* **C-peptide/Insulin Release Tests:** Abnormal results in these tests (Layer 1) are linked to a higher prevalence in Type II Diabetes patients (Layer 2).
* **Blood Glucose:** A high blood glucose level (298) is identified as a diagnostic criterion for diabetes (Layer 2).
* **CKD (Chronic Kidney Disease):** CKD is presented as both a symptom and a cause of diabetes, specifically microangiopathy (Layer 2).
* **Progressive Short-Term Memory Loss:** This is identified as a symptom of diabetes (Layer 2).
* **Hypertension, Dyslipidemia, Coronary Artery Disease:** These are all listed as risk factors for diabetes (Layer 2).
* **Flow:** The diagram shows a convergence of these factors towards a "Suspected Diabetes" stage (Layer 3), then "Diabetes" (Layer 4), and ultimately "Type II Diabetes" (Layer 5).
The text on the left side is fragmented and difficult to interpret fully, but appears to relate to medication or treatment history.
### Key Observations
The diagram emphasizes the multi-faceted nature of Type II Diabetes, highlighting that it can be triggered by a combination of physiological indicators (blood glucose, hormone levels), pre-existing conditions (CKD, hypertension), and symptoms (memory loss). The diagram does not quantify the risk associated with each factor, but rather presents them as contributing elements in a complex pathway.
### Interpretation
This diagram serves as a visual aid for understanding the complex etiology of Type II Diabetes. It suggests that a diagnosis is rarely based on a single factor but rather a constellation of indicators and risk factors. The diagram's structure implies a probabilistic model, where the presence of multiple factors increases the likelihood of a diabetes diagnosis. The inclusion of both symptoms and risk factors suggests a bidirectional relationship, where diabetes can both cause and be caused by these conditions. The fragmented text on the left hints at the importance of patient history and medication in the diagnostic process. The diagram is likely used as a tool for medical professionals to assess patient risk and guide diagnostic testing.