\n
## Scatter Plot: Marketing - Confidence vs. Target Length
### Overview
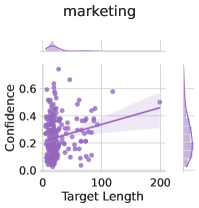
The image presents a scatter plot visualizing the relationship between "Target Length" and "Confidence", likely within a marketing context. A regression line with a confidence interval is overlaid on the scatter points. Marginal distributions are shown above and to the right of the main plot.
### Components/Axes
* **Title:** "marketing" (top-center)
* **X-axis:** "Target Length" (bottom-center), ranging from approximately 0 to 220.
* **Y-axis:** "Confidence" (left-center), ranging from 0.0 to 0.6.
* **Scatter Points:** Numerous purple dots representing individual data points.
* **Regression Line:** A purple line representing the trend of the data. It slopes upwards from left to right.
* **Confidence Interval:** A shaded purple area around the regression line, indicating the uncertainty in the estimated trend.
* **Marginal Distribution (Top):** A density plot showing the distribution of "Target Length".
* **Marginal Distribution (Right):** A density plot showing the distribution of "Confidence".
### Detailed Analysis
The scatter plot shows a generally positive, but weak, correlation between "Target Length" and "Confidence".
* **Trend:** The regression line indicates a slight upward trend: as "Target Length" increases, "Confidence" tends to increase, but the relationship is not strong.
* **Data Points:**
* At a "Target Length" of 0, "Confidence" values range from approximately 0.1 to 0.6.
* At a "Target Length" of 50, "Confidence" values range from approximately 0.15 to 0.5.
* At a "Target Length" of 100, "Confidence" values range from approximately 0.2 to 0.5.
* At a "Target Length" of 150, "Confidence" values range from approximately 0.25 to 0.55.
* At a "Target Length" of 200, "Confidence" values range from approximately 0.3 to 0.55.
* **Marginal Distributions:**
* The "Target Length" distribution is skewed to the right, with a peak around 0-20.
* The "Confidence" distribution is skewed to the right, with a peak around 0.2-0.3.
### Key Observations
* The scatter plot shows a wide spread of data points, indicating a considerable amount of variability in "Confidence" for a given "Target Length".
* The confidence interval around the regression line is relatively wide, suggesting a high degree of uncertainty in the estimated relationship.
* The marginal distributions provide insights into the individual distributions of "Target Length" and "Confidence".
### Interpretation
The data suggests that there is a weak positive relationship between "Target Length" and "Confidence" in this marketing context. However, the relationship is not strong enough to reliably predict "Confidence" based on "Target Length" alone. The wide spread of data points and the wide confidence interval indicate that other factors likely play a significant role in determining "Confidence". The distributions suggest that shorter target lengths and lower confidence levels are more common.
The plot could be used to assess the effectiveness of different marketing strategies or to identify areas for improvement. For example, if the goal is to increase "Confidence", it may be necessary to focus on strategies that target longer lengths, but this should be done cautiously given the weak relationship. Further investigation is needed to understand the underlying factors driving "Confidence" and to develop more effective marketing strategies.