## Line Chart: Number of Benchmarks by Category (2015-2025)
### Overview
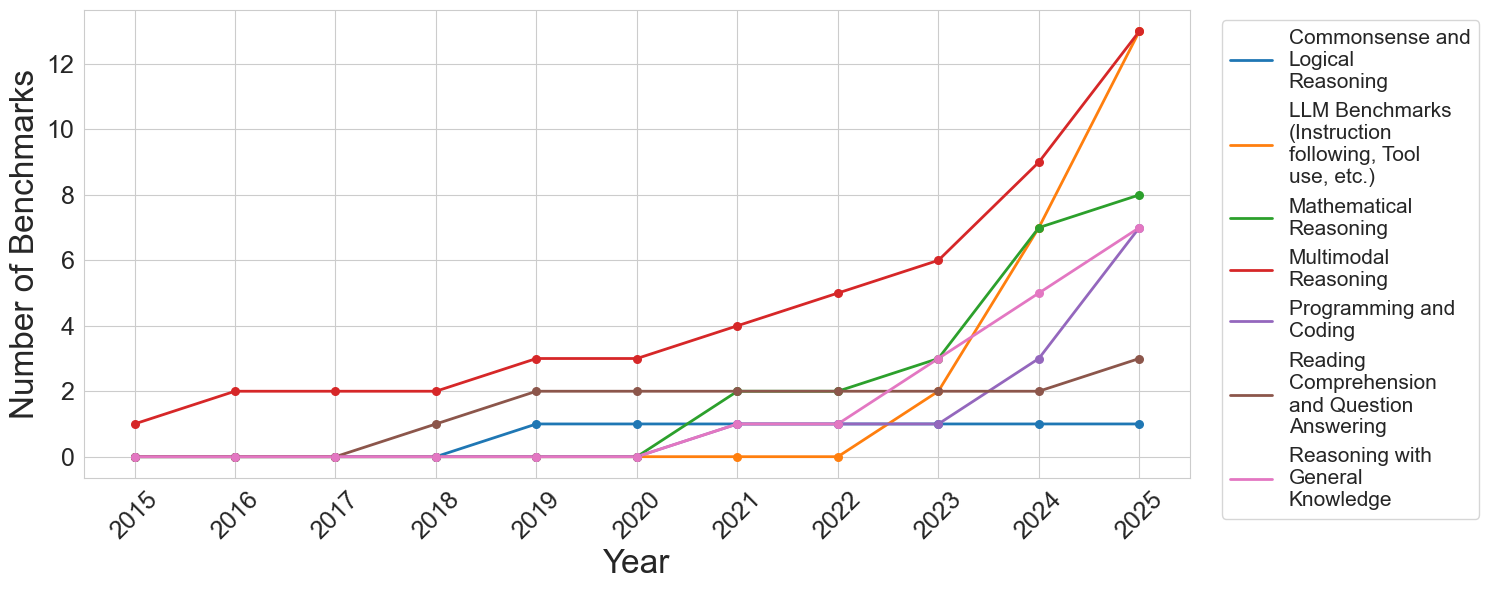
This is a line chart tracking the annual count of distinct AI benchmarks across seven different capability categories from 2015 to 2025. The chart demonstrates a significant and accelerating increase in the total number of benchmarks, particularly from 2022 onward, with the most dramatic growth occurring in the final two years (2024-2025).
### Components/Axes
* **Chart Type:** Multi-line chart.
* **X-Axis (Horizontal):** Labeled "Year". It displays discrete years from 2015 to 2025.
* **Y-Axis (Vertical):** Labeled "Number of Benchmarks". It has a linear scale from 0 to 12, with major gridlines at intervals of 2.
* **Legend:** Positioned to the right of the chart area. It lists seven categories, each associated with a unique colored line:
1. **Commonsense and Logical Reasoning** (Blue line)
2. **LLM Benchmarks (Instruction following, Tool use, etc.)** (Orange line)
3. **Mathematical Reasoning** (Green line)
4. **Multimodal Reasoning** (Red line)
5. **Programming and Coding** (Purple line)
6. **Reading Comprehension and Question Answering** (Brown line)
7. **Reasoning with General Knowledge** (Pink line)
### Detailed Analysis
The following data points are extracted by tracing each colored line against the year markers and the y-axis scale. Values are approximate based on visual alignment with the gridlines.
**1. Commonsense and Logical Reasoning (Blue Line)**
* **Trend:** Flat, then a single step increase.
* **Data Points:** 2015-2018: 0. 2019-2025: 1.
**2. LLM Benchmarks (Instruction following, Tool use, etc.) (Orange Line)**
* **Trend:** Zero for most of the timeline, then explosive growth.
* **Data Points:** 2015-2022: 0. 2023: 2. 2024: 7. 2025: 13.
**3. Mathematical Reasoning (Green Line)**
* **Trend:** Late emergence followed by strong, steady growth.
* **Data Points:** 2015-2020: 0. 2021: 2. 2022: 2. 2023: 3. 2024: 7. 2025: 8.
**4. Multimodal Reasoning (Red Line)**
* **Trend:** Consistent, steady growth throughout the entire period, becoming the category with the highest count by 2025.
* **Data Points:** 2015: 1. 2016: 2. 2017: 2. 2018: 2. 2019: 3. 2020: 3. 2021: 4. 2022: 5. 2023: 6. 2024: 9. 2025: 13.
**5. Programming and Coding (Purple Line)**
* **Trend:** Late emergence with a sharp, recent acceleration.
* **Data Points:** 2015-2021: 0. 2022: 1. 2023: 1. 2024: 3. 2025: 7.
**6. Reading Comprehension and Question Answering (Brown Line)**
* **Trend:** Early emergence, plateau, then a final increase.
* **Data Points:** 2015-2017: 0. 2018: 1. 2019: 2. 2020: 2. 2021: 2. 2022: 2. 2023: 2. 2024: 2. 2025: 3.
**7. Reasoning with General Knowledge (Pink Line)**
* **Trend:** Late emergence with moderate, steady growth.
* **Data Points:** 2015-2020: 0. 2021: 1. 2022: 1. 2023: 3. 2024: 5. 2025: 7.
### Key Observations
1. **Explosive Recent Growth:** The total number of benchmarks across all categories has increased dramatically since 2022. The years 2024 and 2025 show the steepest slopes for most lines.
2. **Category Dominance Shift:** "Multimodal Reasoning" (red) was the leading category for most of the timeline. However, by 2025, "LLM Benchmarks" (orange) has caught up, with both reaching approximately 13 benchmarks.
3. **Emergence of New Categories:** Several categories, notably "LLM Benchmarks," "Programming and Coding," and "Mathematical Reasoning," had zero benchmarks before 2021/2022, indicating these are newer, rapidly developing evaluation areas.
4. **Plateauing Categories:** "Commonsense and Logical Reasoning" (blue) and "Reading Comprehension..." (brown) show much slower growth, suggesting these may be more mature or stable evaluation domains.
5. **2023 as a Pivot Point:** The year 2023 marks an inflection point where the growth rate for nearly all categories (except the two plateauing ones) visibly increases.
### Interpretation
This chart visualizes the rapid evolution and diversification of the AI evaluation landscape. The data suggests a field in a phase of explosive expansion and specialization.
* **The Rise of Capability-Specific Benchmarks:** The late emergence and sharp rise of benchmarks for "LLM Benchmarks" (instruction following, tool use), "Programming," and "Mathematical Reasoning" directly correlate with the release and public adoption of powerful large language models (LLMs) around 2022-2023. The community rapidly developed new tests to measure these newly salient capabilities.
* **Multimodality as a Constant Frontier:** The steady, uninterrupted growth of "Multimodal Reasoning" benchmarks indicates that evaluating AI's ability to integrate different types of information (text, image, etc.) has been a consistent research priority for over a decade, now accelerating.
* **Benchmark Inflation:** The steep upward curves, especially in 2024-2025, may indicate "benchmark inflation"—a proliferation of tests as the field races to keep pace with model capabilities. This raises questions about the consolidation and standardization of evaluation methods.
* **Mature vs. Emerging Domains:** The contrast between the flat lines (blue, brown) and the steeply rising ones (orange, red, green) highlights a shift in research focus from foundational language understanding towards more complex, agentic, and multimodal tasks.
In summary, the chart depicts an AI research field that has moved from establishing basic evaluation metrics to rapidly creating a complex, multi-faceted, and ever-expanding suite of tests to measure increasingly sophisticated and specialized model behaviors.