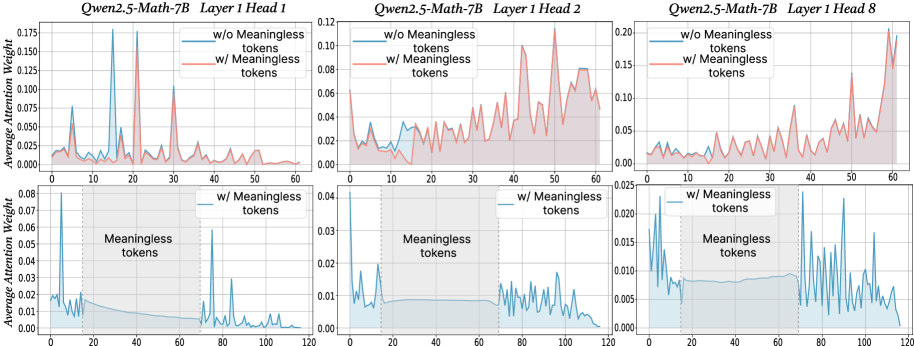
## Chart Type: Multiple Line Graphs of Attention Weights
### Overview
The image presents six line graphs arranged in a 2x3 grid. Each graph displays the average attention weight of a model (Qwen2.5-Math-7B) across different tokens, with and without "meaningless" tokens. The graphs are grouped by layer head (1, 2, and 8), with two graphs per head showing different ranges of tokens (0-60 and 0-120).
### Components/Axes
**General Components:**
* **Titles:** Each of the three columns has a title indicating the model and layer head: "Qwen2.5-Math-7B Layer 1 Head 1", "Qwen2.5-Math-7B Layer 1 Head 2", and "Qwen2.5-Math-7B Layer 1 Head 8".
* **Legends:** Each of the six graphs has a legend in the top-right corner indicating two data series: "w/o Meaningless tokens" (blue line) and "w/ Meaningless tokens" (red line). The bottom three graphs only show the "w/ Meaningless tokens" (blue line).
* **Grid:** All graphs have a light gray grid in the background.
**Axes (Top Row):**
* **Y-axis:** "Average Attention Weight" with a scale from 0.000 to 0.175 (Head 1), 0.00 to 0.12 (Head 2), and 0.00 to 0.20 (Head 8).
* **X-axis:** Token index, ranging from 0 to 60.
**Axes (Bottom Row):**
* **Y-axis:** "Average Attention Weight" with a scale from 0.00 to 0.08 (Head 1), 0.00 to 0.04 (Head 2), and 0.00 to 0.025 (Head 8).
* **X-axis:** Token index, ranging from 0 to 120.
* **Shaded Region:** A shaded light-blue region is present from approximately token 20 to token 70, labeled "Meaningless tokens". This region is bounded by vertical dotted lines at x=20 and x=70.
### Detailed Analysis
**Qwen2.5-Math-7B Layer 1 Head 1:**
* **Top Graph (Tokens 0-60):**
* **w/o Meaningless tokens (blue):** The line starts around 0.02, peaks sharply around token 5 (approx. 0.07), then fluctuates between 0.01 and 0.03.
* **w/ Meaningless tokens (red):** The line starts around 0.02, peaks sharply around token 20 (approx. 0.175), then fluctuates between 0.01 and 0.03.
* **Bottom Graph (Tokens 0-120):**
* **w/ Meaningless tokens (blue):** The line starts high (approx. 0.08), drops sharply to around 0.01 by token 20, remains relatively flat within the "Meaningless tokens" region, and then fluctuates between 0.00 and 0.01 for the remaining tokens.
**Qwen2.5-Math-7B Layer 1 Head 2:**
* **Top Graph (Tokens 0-60):**
* **w/o Meaningless tokens (blue):** The line fluctuates between 0.01 and 0.03.
* **w/ Meaningless tokens (red):** The line fluctuates between 0.01 and 0.10, with a peak around token 60 (approx. 0.12).
* **Bottom Graph (Tokens 0-120):**
* **w/ Meaningless tokens (blue):** The line starts high (approx. 0.04), drops sharply to around 0.01 by token 20, remains relatively flat within the "Meaningless tokens" region, and then fluctuates between 0.00 and 0.01 for the remaining tokens.
**Qwen2.5-Math-7B Layer 1 Head 8:**
* **Top Graph (Tokens 0-60):**
* **w/o Meaningless tokens (blue):** The line fluctuates between 0.01 and 0.04.
* **w/ Meaningless tokens (red):** The line fluctuates between 0.01 and 0.10, with a sharp peak around token 60 (approx. 0.20).
* **Bottom Graph (Tokens 0-120):**
* **w/ Meaningless tokens (blue):** The line starts high (approx. 0.02), drops sharply to around 0.005 by token 20, remains relatively flat within the "Meaningless tokens" region, and then fluctuates between 0.005 and 0.015 for the remaining tokens.
### Key Observations
* The "w/ Meaningless tokens" data series (red in the top graphs) generally shows higher attention weights than the "w/o Meaningless tokens" data series (blue in the top graphs), especially in the top graphs.
* In the bottom graphs, the attention weight for "w/ Meaningless tokens" (blue) drops significantly after the initial tokens and remains low within the "Meaningless tokens" region (tokens 20-70).
* The attention weights for Head 1 are generally lower than those for Heads 2 and 8 in the top graphs.
* The bottom graphs show a clear distinction in attention weight before, during, and after the "Meaningless tokens" region.
### Interpretation
The graphs illustrate how the presence of "meaningless" tokens affects the attention weights of the Qwen2.5-Math-7B model. The higher attention weights observed in the top graphs when "meaningless" tokens are included suggest that the model may be allocating more attention to these tokens, especially around specific token indices (e.g., token 20 for Head 1, token 60 for Heads 2 and 8).
The bottom graphs provide further insight into the model's behavior. The sharp drop in attention weight after the initial tokens, followed by a sustained low attention weight within the "Meaningless tokens" region, indicates that the model may be effectively ignoring these tokens. The subsequent fluctuations in attention weight after the "Meaningless tokens" region suggest that the model is re-engaging with the remaining tokens.
The differences in attention weights across different heads (1, 2, and 8) suggest that different attention heads may be specialized for processing different types of tokens or features within the input sequence.