## Line Chart: Test Accuracy vs. Graph Signal
### Overview
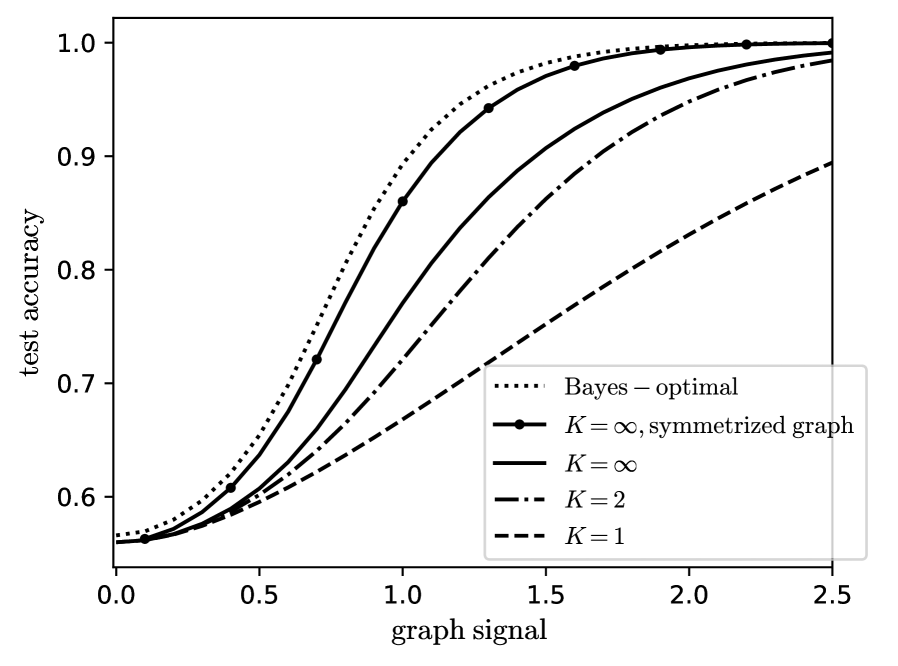
The chart illustrates the relationship between test accuracy and graph signal strength for different model configurations. Test accuracy increases monotonically with graph signal strength, with distinct performance curves for various parameter settings (K values) and a theoretical Bayes-optimal baseline.
### Components/Axes
- **Y-axis**: Test accuracy (0.5 to 1.0)
- **X-axis**: Graph signal (0.0 to 2.5)
- **Legend**: Located in bottom-right corner, containing five entries:
1. Bayes-optimal (dotted line)
2. K=∞, symmetrized graph (solid line with dots)
3. K=∞ (solid line)
4. K=2 (dashed line)
5. K=1 (dash-dotted line)
### Detailed Analysis
1. **Bayes-optimal (dotted line)**:
- Starts at ~0.55 accuracy at graph signal 0.0
- Reaches ~1.0 accuracy at graph signal 2.5
- Shows smooth, consistent upward trend
2. **K=∞, symmetrized graph (solid line with dots)**:
- Begins at ~0.54 accuracy at graph signal 0.0
- Converges to Bayes-optimal performance by graph signal 1.5
- Matches Bayes-optimal curve exactly at graph signal 2.5
3. **K=∞ (solid line)**:
- Starts at ~0.53 accuracy at graph signal 0.0
- Approaches Bayes-optimal performance by graph signal 2.0
- Slightly lags behind symmetrized version at all points
4. **K=2 (dashed line)**:
- Begins at ~0.52 accuracy at graph signal 0.0
- Reaches ~0.95 accuracy at graph signal 2.5
- Shows gradual improvement with increasing graph signal
5. **K=1 (dash-dotted line)**:
- Starts at ~0.51 accuracy at graph signal 0.0
- Reaches ~0.90 accuracy at graph signal 2.5
- Demonstrates slowest improvement among all curves
### Key Observations
- All curves show positive correlation between graph signal and test accuracy
- Bayes-optimal performance serves as upper bound for all configurations
- Symmetrized graph with K=∞ achieves near-optimal performance
- Higher K values (∞ > 2 > 1) correspond to better performance
- Performance gap between K=∞ and K=1 narrows as graph signal increases
### Interpretation
The data demonstrates that increasing graph signal strength improves model performance across all configurations. The Bayes-optimal curve represents the theoretical maximum achievable accuracy. The K=∞, symmetrized graph configuration achieves performance nearly identical to the optimal, suggesting that graph symmetrization effectively captures essential information even with infinite parameters. Lower K values (1 and 2) show diminishing returns, indicating that model complexity (parameter count) significantly impacts performance when graph signal is limited. The convergence of K=∞ curves to Bayes-optimal performance at high graph signal strength implies that with sufficient data quality, even simple models can approach optimal performance through appropriate architectural choices like graph symmetrization.