## Line Graph: LM Loss vs. PFlOP/s-days for MoBA and Full Attention Projections
### Overview
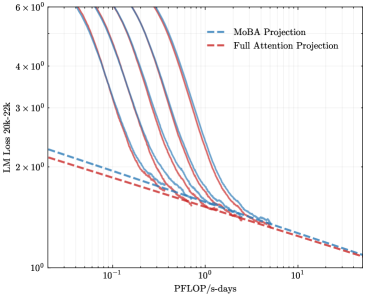
The image is a logarithmic line graph comparing the language model (LM) loss (measured in 20k-22k) against computational efficiency (PFlOP/s-days) for two model architectures: MoBA Projection (blue dashed line) and Full Attention Projection (red dashed line). Both lines exhibit exponential decay trends, with MoBA initially outperforming Full Attention at lower computational budgets but converging at higher scales.
### Components/Axes
- **X-axis (Horizontal)**:
- Label: "PFlOP/s-days" (logarithmic scale)
- Range: 10⁻¹ to 10¹
- Tick markers: 10⁻¹, 10⁰, 10¹
- **Y-axis (Vertical)**:
- Label: "LM Loss 20k-22k" (logarithmic scale)
- Range: 10⁰ to 6×10⁰
- Tick markers: 10⁰, 2×10⁰, 3×10⁰, 4×10⁰, 5×10⁰, 6×10⁰
- **Legend**:
- Position: Top-right corner
- Entries:
- Blue dashed line: "MoBA Projection"
- Red dashed line: "Full Attention Projection"
### Detailed Analysis
1. **MoBA Projection (Blue Dashed Line)**:
- Starts at ~5×10⁰ LM Loss at 10⁻¹ PFlOP/s-days.
- Declines sharply, crossing below 2×10⁰ LM Loss by ~10⁰ PFlOP/s-days.
- Continues to decrease, reaching ~1.2×10⁰ LM Loss at 10¹ PFlOP/s-days.
2. **Full Attention Projection (Red Dashed Line)**:
- Begins at ~2.5×10⁰ LM Loss at 10⁻¹ PFlOP/s-days.
- Decreases more gradually than MoBA, crossing below MoBA’s curve at ~10⁰.⁵ PFlOP/s-days.
- Reaches ~1.1×10⁰ LM Loss at 10¹ PFlOP/s-days.
3. **Intersection Point**:
- The two lines intersect at ~10⁰.⁵ PFlOP/s-days, where LM Loss is approximately 1.8×10⁰.
- Below this point, MoBA outperforms Full Attention; above it, Full Attention becomes more efficient.
### Key Observations
- **Exponential Scaling**: Both models show logarithmic improvements in LM Loss as computational resources increase, but MoBA’s gains are steeper initially.
- **Efficiency Threshold**: Full Attention surpasses MoBA in efficiency only when computational resources exceed ~3×10⁰ PFlOP/s-days.
- **Convergence**: At 10¹ PFlOP/s-days, both models achieve similar LM Loss (~1.1–1.2×10⁰), suggesting diminishing returns beyond this scale.
### Interpretation
The graph highlights a trade-off between computational efficiency and model architecture. MoBA is more effective for low-to-moderate computational budgets (≤10⁰ PFlOP/s-days), while Full Attention becomes preferable for high-resource scenarios (≥10¹ PFlOP/s-days). The logarithmic axes emphasize that small increases in computational power yield disproportionate reductions in LM Loss, particularly for MoBA. This suggests that MoBA could be prioritized in resource-constrained environments, whereas Full Attention may be optimal for large-scale deployments. The intersection point underscores the importance of aligning model selection with specific computational constraints.