## 3D Scene Reconstruction Dataset Visualization
### Overview
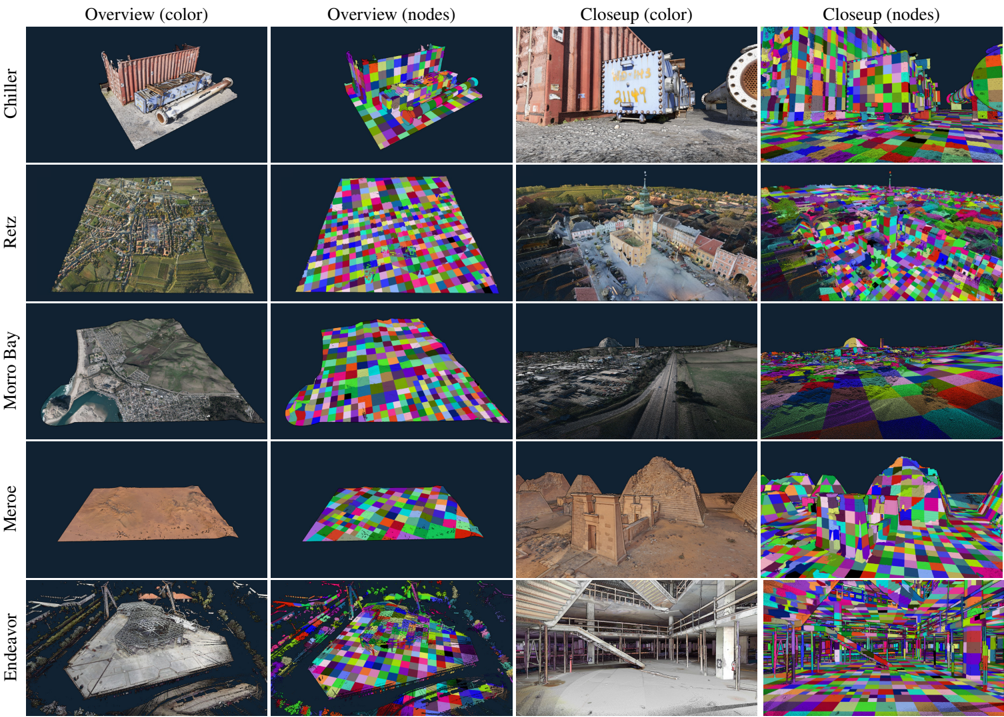
The image is a composite figure, likely from a technical paper or presentation, showcasing five different 3D scene datasets. It is structured as a 5x4 grid. Each row represents a distinct dataset, labeled on the far left. Each column represents a specific visualization type of that dataset, with headers at the top. The figure compares photorealistic color renders with corresponding "node" visualizations (likely representing mesh vertices, segmentation, or feature points) from both an overview and a close-up perspective.
### Components/Axes
**Row Labels (Vertical Axis, Left Side):**
1. **Chiller**
2. **Reitz**
3. **Morro Bay**
4. **Meroe**
5. **Endeavor**
**Column Headers (Horizontal Axis, Top):**
1. **Overview (color)** - A wide-angle, photorealistic 3D render of the entire scene.
2. **Overview (nodes)** - The same wide-angle view, but with a multicolored checkerboard pattern overlaid on the geometry, representing nodes or segments.
3. **Closeup (color)** - A detailed, zoomed-in photorealistic render of a specific area within the scene.
4. **Closeup (nodes)** - The same detailed view with the multicolored node/segmentation overlay.
### Detailed Analysis
The grid contains 20 individual image panels. The content of each row is as follows:
- **Row 1: Chiller**
- *Overview (color):* Shows an industrial chiller unit with pipes on a concrete pad.
- *Overview (nodes):* The same chiller unit and ground plane are covered in a grid of brightly colored squares (red, green, blue, yellow, magenta, cyan).
- *Closeup (color):* A tighter shot focusing on the chiller's control panel and adjacent large pipe flange.
- *Closeup (nodes):* The close-up view with the same colorful node pattern applied to all surfaces.
- **Row 2: Reitz**
- *Overview (color):* An aerial view of a small European-style town with a central church spire, surrounded by fields.
- *Overview (nodes):* The entire town and terrain are represented by the multicolored node grid.
- *Closeup (color):* A street-level view looking towards the town square and church.
- *Closeup (nodes):* The street-level view with nodes covering buildings, ground, and sky.
- **Row 3: Morro Bay**
- *Overview (color):* A coastal landscape featuring a large rock formation (Morro Rock), a bay, and a town.
- *Overview (nodes):* The coastal terrain and rock are visualized with the node pattern.
- *Closeup (color):* A view along a road or path near the coast, with buildings and the rock in the distance.
- *Closeup (nodes):* The coastal path view with the node overlay.
- **Row 4: Meroe**
- *Overview (color):* A desert landscape showing the ruins of ancient pyramids or structures.
- *Overview (nodes):* The desert ground and pyramid structures are covered in the node grid.
- *Closeup (color):* A detailed view of the weathered brickwork of one of the ancient structures.
- *Closeup (nodes):* The detailed structure view with the node pattern.
- **Row 5: Endeavor**
- *Overview (color):* An overhead view of a complex industrial or construction site with a large circular foundation.
- *Overview (nodes):* The entire industrial site geometry is represented by the node pattern.
- *Closeup (color):* An interior view of a large, unfinished building with exposed steel beams and a staircase.
- *Closeup (nodes):* The interior view with nodes applied to all structural elements and floors.
### Key Observations
1. **Consistent Visualization Schema:** The "nodes" visualization uses an identical, vibrant, multi-colored checkerboard pattern across all five datasets, suggesting a standardized method for displaying mesh topology, segmentation, or feature point distribution.
2. **Scene Diversity:** The datasets cover a wide range of environments: industrial object (Chiller), urban/town (Reitz), coastal (Morro Bay), archaeological/desert (Meroe), and large-scale industrial/construction (Endeavor).
3. **Scale Variation:** The "Overview" vs. "Closeup" columns demonstrate the model's or dataset's capability at both macro (entire scene) and micro (detailed surface) scales.
4. **Data Fidelity:** The "color" renders appear to be high-quality, photorealistic reconstructions or synthetic renders, indicating the source data is likely RGB-D scans, photogrammetry, or high-fidelity synthetic environments.
### Interpretation
This figure serves as a qualitative showcase for a 3D scene understanding, reconstruction, or segmentation system. The primary purpose is to visually demonstrate the system's output or the nature of the datasets used for training/evaluation.
- **What it demonstrates:** The side-by-side comparison of "color" and "nodes" views allows a viewer to assess how well the underlying geometric representation (the nodes) aligns with the photorealistic appearance. The consistency of the node pattern suggests a unified representation format across diverse scenes.
- **Relationship between elements:** The rows establish the breadth of testing environments, while the columns establish the depth of analysis (global vs. local, appearance vs. geometry). The "Closeup" views are critical for evaluating fine-grained detail preservation.
- **Notable patterns:** The most significant pattern is the application of a uniform, artificial color scheme to natural and man-made scenes in the "nodes" columns. This is not an aesthetic choice but a technical one, likely to make individual segments or vertices visually distinct for analysis. The outlier in terms of scene content is "Chiller," which is a single object scan rather than an environmental scene, indicating the method is being tested on both object-level and scene-level data.
- **Underlying purpose:** This type of visualization is common in computer vision research papers dealing with 3D semantic segmentation, neural radiance fields (NeRFs), or mesh reconstruction. It provides intuitive, visual proof of concept that the method can handle complex, real-world geometry across various domains. The figure argues for the robustness and generalizability of the associated technical approach.