## Chart/Diagram Type: Composite Figure - System Diagram, Line Plot, and Image Comparison
### Overview
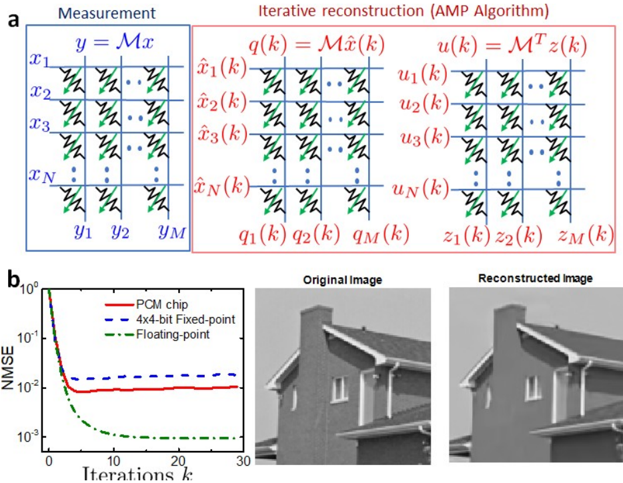
The image presents a composite figure consisting of three parts: (a) a system diagram illustrating a measurement and iterative reconstruction process using the AMP algorithm, (b) a line plot comparing the NMSE (Normalized Mean Squared Error) performance of three different methods (PCM chip, 4x4-bit Fixed-point, and Floating-point) over iterations, and (c) a visual comparison of an original image and its reconstructed version.
### Components/Axes
**Part (a): System Diagram**
* **Title:** Measurement (left, blue box) and Iterative reconstruction (AMP Algorithm) (right, red box)
* **Measurement Block:**
* Equation: y = Mx (blue)
* Input variables: x1, x2, x3, ..., xN (left side)
* Output variables: y1, y2, ..., yM (bottom)
* Diagram: A grid structure with arrows indicating the flow from x_i to y_j.
* **Iterative Reconstruction Block:**
* Equations: q(k) = M x̂(k) and u(k) = M^T z(k) (red)
* Variables: x̂1(k), x̂2(k), x̂3(k), ..., x̂N(k) (left side of first equation)
* Variables: q1(k), q2(k), ..., qM(k) (bottom of first equation)
* Variables: u1(k), u2(k), u3(k), ..., uN(k) (top of second equation)
* Variables: z1(k), z2(k), ..., zM(k) (bottom of second equation)
* Diagram: Similar grid structure with arrows indicating flow.
**Part (b): Line Plot**
* **Title:** None explicitly given, but it's implied to be a comparison of NMSE vs. Iterations for different methods.
* **Y-axis:** NMSE (Normalized Mean Squared Error), logarithmic scale from 10^-3 to 10^0.
* **X-axis:** Iterations k, linear scale from 0 to 30.
* **Legend:** (top-right)
* Red solid line: PCM chip
* Blue dashed line: 4x4-bit Fixed-point
* Green dash-dotted line: Floating-point
**Part (c): Image Comparison**
* **Titles:** Original Image (left) and Reconstructed Image (right)
* Images: Grayscale images of a house.
### Detailed Analysis or ### Content Details
**Part (a): System Diagram**
* The diagram illustrates a measurement process where the input vector 'x' is transformed into the output vector 'y' using a matrix 'M'.
* The iterative reconstruction process uses the AMP (Approximate Message Passing) algorithm to estimate 'x' from 'y'.
* The variables x̂(k), q(k), u(k), and z(k) represent intermediate values in the iterative process at iteration 'k'.
**Part (b): Line Plot**
* **PCM chip (Red solid line):** Starts at approximately 0.2 NMSE, quickly decreases to around 0.01 NMSE within the first 5 iterations, and then plateaus around 0.01 NMSE for the remaining iterations.
* **4x4-bit Fixed-point (Blue dashed line):** Starts at approximately 0.8 NMSE, decreases to around 0.02 NMSE within the first 5 iterations, and then plateaus around 0.02 NMSE for the remaining iterations.
* **Floating-point (Green dash-dotted line):** Starts at approximately 1 NMSE, rapidly decreases to below 0.001 NMSE within the first 10 iterations, and continues to decrease slightly for the remaining iterations.
**Part (c): Image Comparison**
* The original image shows a clear, detailed view of a house.
* The reconstructed image shows a slightly blurred version of the same house, indicating some loss of detail during the reconstruction process.
### Key Observations
* The Floating-point method achieves the lowest NMSE and converges the fastest.
* The PCM chip method performs better than the 4x4-bit Fixed-point method in terms of NMSE.
* The iterative reconstruction process reduces the NMSE over iterations for all three methods.
* The reconstructed image is visually similar to the original image, but with some loss of detail.
### Interpretation
The composite figure demonstrates the performance of different methods for reconstructing an image using an iterative algorithm. The line plot shows that the Floating-point method is the most accurate and efficient, while the PCM chip and 4x4-bit Fixed-point methods have higher NMSE values. The image comparison visually confirms that the reconstruction process introduces some level of distortion, but the overall structure of the image is preserved. The system diagram provides a high-level overview of the measurement and reconstruction process, highlighting the key variables and equations involved. The data suggests that the choice of method significantly impacts the accuracy and efficiency of the image reconstruction process.