# Technical Document: LLM Factuality Self-Evaluation and Alignment Workflow
This document describes a three-step technical process for improving the factuality of Large Language Models (LLMs) through response sampling, self-evaluation, and preference-based fine-tuning.
---
## 1. Component Isolation
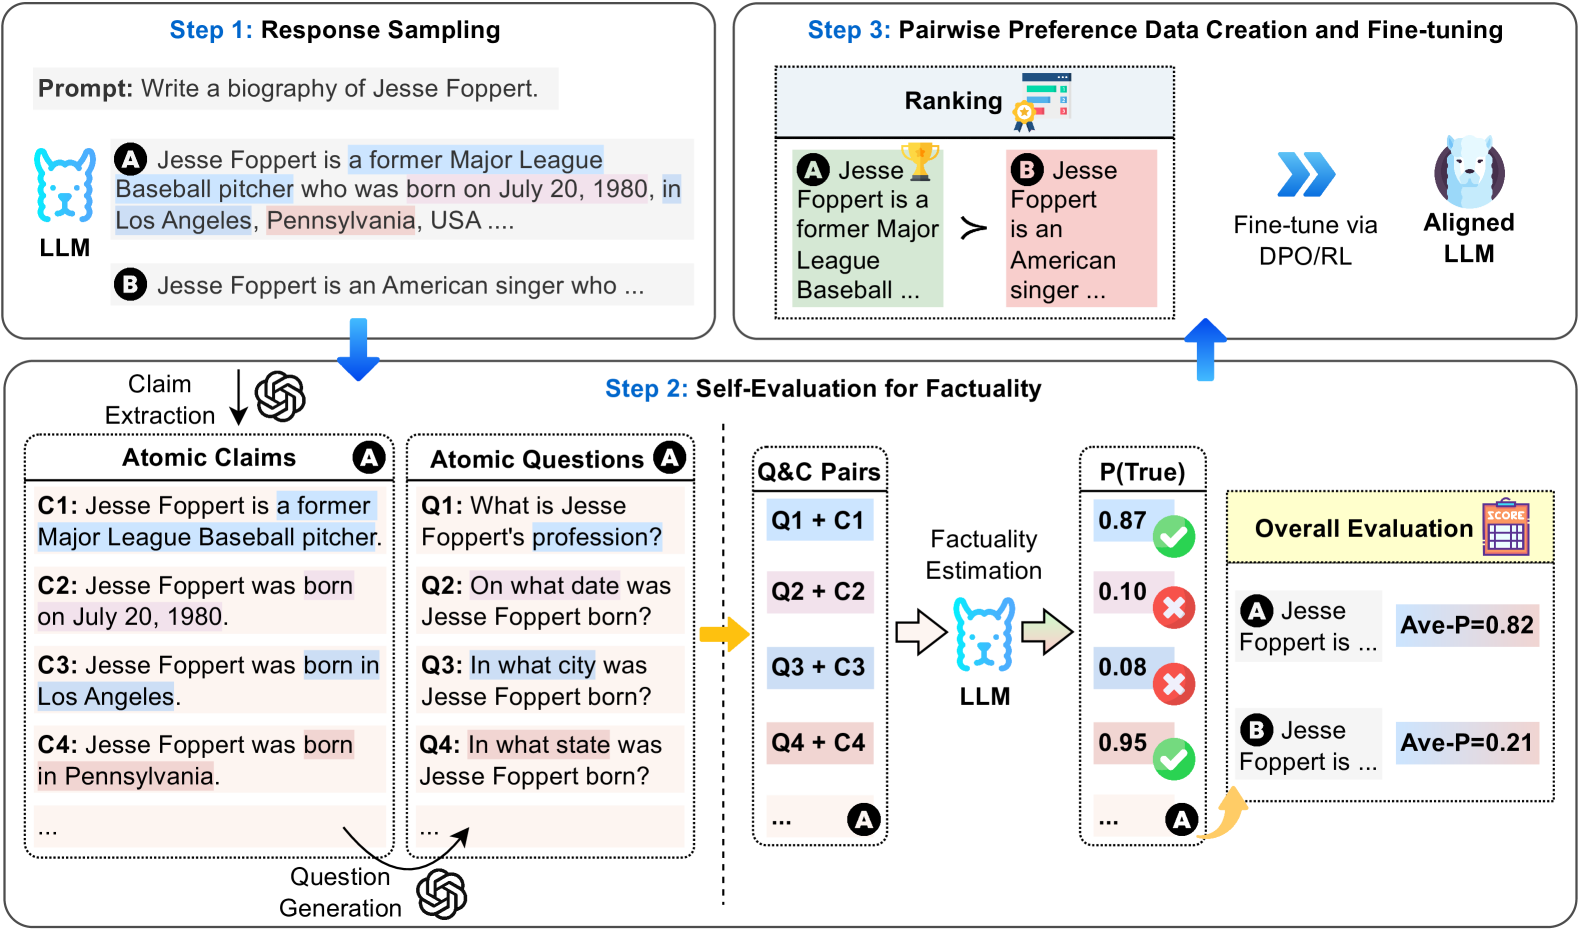
The image is organized into three primary regions representing a sequential pipeline:
* **Top-Left (Step 1):** Response Sampling.
* **Bottom (Step 2):** Self-Evaluation for Factuality (The core processing stage).
* **Top-Right (Step 3):** Pairwise Preference Data Creation and Fine-tuning.
---
## 2. Detailed Process Flow
### Step 1: Response Sampling
The process begins with a user prompt provided to an LLM.
* **Prompt:** "Write a biography of Jesse Foppert."
* **Outputs:** The LLM generates multiple candidate responses:
* **Response A:** "Jesse Foppert is a former Major League Baseball pitcher who was born on July 20, 1980, in Los Angeles, Pennsylvania, USA ...."
* **Response B:** "Jesse Foppert is an American singer who ..."
### Step 2: Self-Evaluation for Factuality
This stage breaks down the responses into verifiable units to estimate their accuracy.
#### A. Claim Extraction & Question Generation
Response A is processed into "Atomic Claims" and corresponding "Atomic Questions":
| ID | Atomic Claim (C) | Atomic Question (Q) |
| :--- | :--- | :--- |
| 1 | Jesse Foppert is a former Major League Baseball pitcher. | What is Jesse Foppert's profession? |
| 2 | Jesse Foppert was born on July 20, 1980. | On what date was Jesse Foppert born? |
| 3 | Jesse Foppert was born in Los Angeles. | In what city was Jesse Foppert born? |
| 4 | Jesse Foppert was born in Pennsylvania. | In what state was Jesse Foppert born? |
#### B. Factuality Estimation
The system pairs each question with its claim (**Q&C Pairs**) and feeds them back into an LLM for verification. The LLM outputs a probability score **P(True)**:
* **Q1 + C1:** 0.87 (Marked with a Green Checkmark - **True**)
* **Q2 + C2:** 0.10 (Marked with a Red X - **False**)
* **Q3 + C3:** 0.08 (Marked with a Red X - **False**)
* **Q4 + C4:** 0.95 (Marked with a Green Checkmark - **True**)
#### C. Overall Evaluation
The individual scores are aggregated into an average probability (**Ave-P**) for each response:
* **Response A:** Ave-P = 0.82
* **Response B:** Ave-P = 0.21
### Step 3: Pairwise Preference Data Creation and Fine-tuning
The final stage uses the evaluation scores to align the model.
* **Ranking:** The system compares the responses based on their factuality scores. Since 0.82 > 0.21, **Response A** is ranked higher than **Response B** (indicated by the `>` symbol).
* Response A (Green background) is the "Winner" (Gold Trophy icon).
* Response B (Red background) is the "Loser".
* **Alignment:** This preference data is used to "Fine-tune via DPO/RL" (Direct Preference Optimization or Reinforcement Learning).
* **Outcome:** The process results in an **Aligned LLM** (represented by a white wolf/husky icon).
---
## 3. Visual and Symbolic Annotations
* **Color Coding:**
* **Blue highlights:** Used for correct or professional information (e.g., "former Major League Baseball pitcher", "Los Angeles").
* **Red/Pink highlights:** Used for incorrect or conflicting information (e.g., "Pennsylvania" in the context of Los Angeles, or low-probability claims).
* **Icons:**
* **OpenAI Logo:** Indicates the use of a model (likely GPT-based) for claim extraction and question generation.
* **Wolf/Husky Icon:** Represents the internal LLM being evaluated and aligned.
* **Check/X Marks:** Indicate the binary result of the factuality estimation threshold.
* **Directional Flow:** Blue arrows indicate the primary data flow from sampling to evaluation, then to ranking, and finally to the alignment of the model.