\n
## Diagram: Memory Controller Operation Phases
### Overview
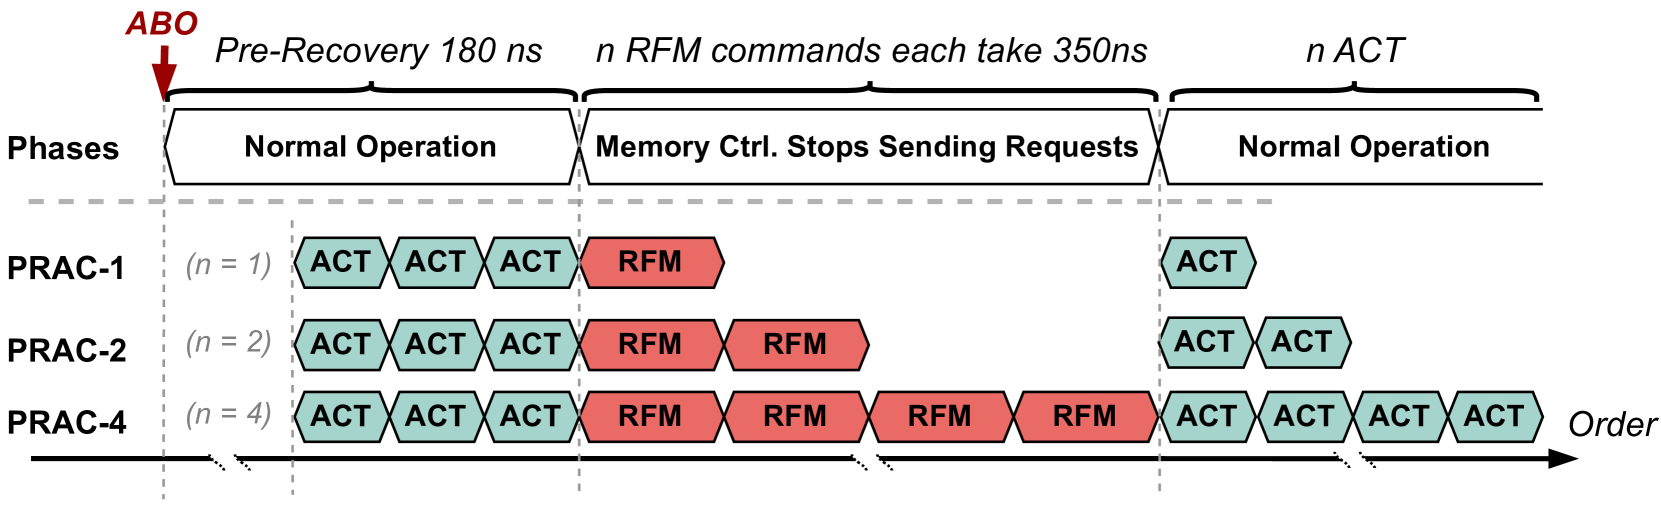
The diagram illustrates the phases of operation for a memory controller following an ABO (Abort) event, showing how the number of parallel requests (PRAC-1, PRAC-2, PRAC-4) affects the recovery process. The diagram depicts a timeline divided into phases: Normal Operation, Memory Controller Stops Sending Requests, and a return to Normal Operation. It highlights the execution of ACT (Active) and RFM (Refresh) commands during these phases.
### Components/Axes
* **Vertical Axis:** "Phases" - labeled with "Normal Operation" and "Memory Ctrl. Stops Sending Requests".
* **Horizontal Axis:** "Order" - representing the sequence of commands over time.
* **PRAC-1:** Represents the case with n=1 parallel requests.
* **PRAC-2:** Represents the case with n=2 parallel requests.
* **PRAC-4:** Represents the case with n=4 parallel requests.
* **ACT:** Green rectangles representing Active commands.
* **RFM:** Red rectangles representing Refresh commands.
* **ABO:** Red downward pointing triangle indicating the abort event.
* **Time Annotations:** "Pre-Recovery 180 ns", "n RFM commands each take 350ns", "n ACT".
### Detailed Analysis
The diagram shows three scenarios (PRAC-1, PRAC-2, PRAC-4) illustrating the impact of the number of parallel requests on the recovery process after an ABO event.
* **PRAC-1 (n=1):**
* Before ABO: Three ACT commands are executed.
* After ABO: One RFM command is executed.
* Return to Normal: One ACT command is executed.
* **PRAC-2 (n=2):**
* Before ABO: Three ACT commands are executed.
* After ABO: Two RFM commands are executed.
* Return to Normal: Two ACT commands are executed.
* **PRAC-4 (n=4):**
* Before ABO: Three ACT commands are executed.
* After ABO: Four RFM commands are executed.
* Return to Normal: Four ACT commands are executed.
The diagram indicates that the pre-recovery phase takes 180 ns. Each RFM command takes 350 ns. The number of RFM commands executed during the "Memory Ctrl. Stops Sending Requests" phase corresponds to the value of 'n' for each PRAC scenario. The time taken for the ACT commands is denoted as 'n ACT', but no specific duration is provided.
### Key Observations
* The number of RFM commands executed during the recovery phase directly correlates with the number of parallel requests (n).
* The diagram visually demonstrates that a higher number of parallel requests (PRAC-4) requires more RFM commands to be executed during the recovery phase compared to lower numbers of parallel requests (PRAC-1, PRAC-2).
* The diagram does not provide specific timing information for the ACT commands, only indicating that 'n' ACT commands are executed.
### Interpretation
The diagram illustrates a memory controller's response to an abort event, specifically focusing on the refresh operations needed to restore data integrity. The number of RFM commands executed is directly proportional to the number of active requests at the time of the abort. This suggests that the memory controller needs to refresh the data associated with each outstanding request to ensure consistency after an error. The diagram highlights a trade-off: increasing the number of parallel requests can improve performance during normal operation, but it also increases the recovery time after an abort event due to the need for more refresh operations. The diagram is a simplified model, and doesn't account for potential variations in RFM command execution time or other factors that could influence recovery performance. The diagram is a visual aid for understanding the relationship between parallel requests, abort events, and memory refresh operations in a memory controller.