\n
## Bar and Line Chart: Surrogate Model Performance
### Overview
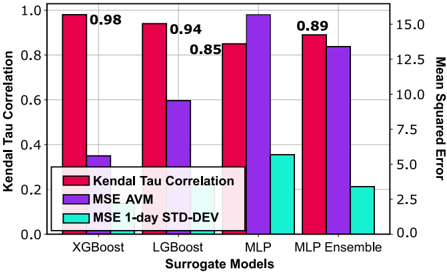
This image presents a combined bar and line chart comparing the performance of four surrogate models: XGBoost, LGBoost, MLP, and MLP Ensemble. The chart displays two primary metrics: Kendall Tau Correlation (represented by bars) and Mean Squared Error (MSE) for both AVM (Average Monthly Volume) and 1-day STD-DEV (Standard Deviation) – the latter represented by lines. The x-axis represents the surrogate models, while the left y-axis represents Kendall Tau Correlation and the right y-axis represents Mean Squared Error.
### Components/Axes
* **X-axis:** Surrogate Models (XGBoost, LGBoost, MLP, MLP Ensemble)
* **Left Y-axis:** Kendall Tau Correlation (Scale: 0.0 to 1.0)
* **Right Y-axis:** Mean Squared Error (Scale: 0.0 to 15.0)
* **Legend:**
* Kendall Tau Correlation (Red)
* MSE AVM (Purple)
* MSE 1-day STD-DEV (Cyan)
### Detailed Analysis
The chart consists of four groups of bars and two lines for each model.
**XGBoost:**
* Kendall Tau Correlation: Approximately 0.98 (Red bar)
* MSE AVM: Approximately 0.3 (Purple line)
* MSE 1-day STD-DEV: Approximately 3.5 (Cyan line)
**LGBoost:**
* Kendall Tau Correlation: Approximately 0.94 (Red bar)
* MSE AVM: Approximately 0.6 (Purple line)
* MSE 1-day STD-DEV: Approximately 2.5 (Cyan line)
**MLP:**
* Kendall Tau Correlation: Approximately 0.85 (Red bar)
* MSE AVM: Approximately 1.0 (Purple line)
* MSE 1-day STD-DEV: Approximately 3.5 (Cyan line)
**MLP Ensemble:**
* Kendall Tau Correlation: Approximately 0.89 (Red bar)
* MSE AVM: Approximately 0.2 (Purple line)
* MSE 1-day STD-DEV: Approximately 2.2 (Cyan line)
The red bars representing Kendall Tau Correlation generally decrease from XGBoost to LGBoost, then decrease to MLP, and slightly increase for MLP Ensemble. The purple lines representing MSE AVM show a decrease from XGBoost to LGBoost, then increase to MLP, and decrease again for MLP Ensemble. The cyan lines representing MSE 1-day STD-DEV show a decrease from XGBoost to LGBoost, then remain constant to MLP, and decrease for MLP Ensemble.
### Key Observations
* XGBoost exhibits the highest Kendall Tau Correlation and the lowest MSE AVM.
* MLP has the lowest Kendall Tau Correlation and the highest MSE AVM.
* The MSE 1-day STD-DEV is relatively consistent across XGBoost and MLP, but lower for LGBoost and MLP Ensemble.
* There is an inverse relationship between Kendall Tau Correlation and MSE values; higher correlation generally corresponds to lower MSE.
### Interpretation
The data suggests that XGBoost is the most effective surrogate model based on the metrics presented, demonstrating a strong positive correlation with the target variable and low prediction error. LGBoost and MLP Ensemble also perform reasonably well, while MLP appears to be the least effective model. The difference in MSE between AVM and 1-day STD-DEV indicates that predicting AVM is more challenging than predicting 1-day STD-DEV for these models. The combination of metrics provides a comprehensive assessment of model performance, highlighting the trade-offs between correlation and error. The use of both correlation and MSE allows for a nuanced understanding of how well each model captures the underlying patterns in the data and minimizes prediction inaccuracies. The slight improvement of the MLP Ensemble over the standalone MLP suggests that ensembling techniques can enhance model performance.