## Line Graph: Learning Rate Schedule
### Overview
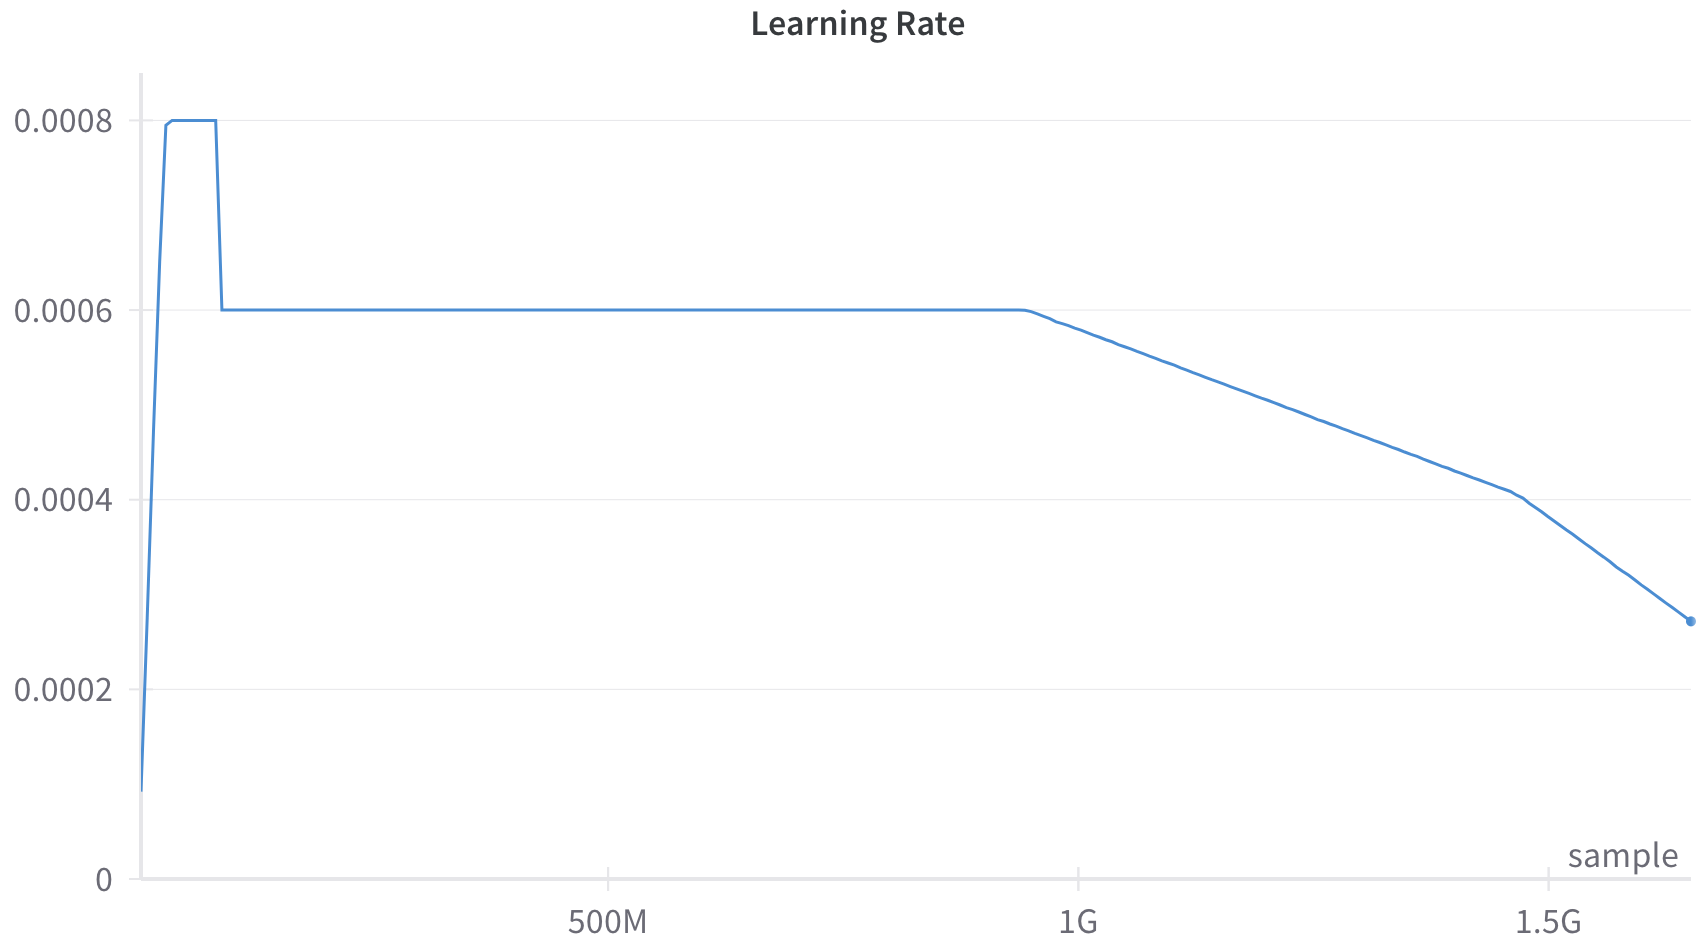
The image displays a line graph titled "Learning Rate," plotting the learning rate value against the number of training samples processed. The graph illustrates a common learning rate schedule used in machine learning model training, featuring distinct phases: a warm-up, a constant period, and a linear decay.
### Components/Axes
* **Title:** "Learning Rate" (centered at the top).
* **Y-Axis (Vertical):** Represents the learning rate value. It is a linear scale with labeled tick marks at:
* 0
* 0.0002
* 0.0004
* 0.0006
* 0.0008
* **X-Axis (Horizontal):** Represents the number of training samples processed. It is labeled "sample" at the bottom-right. The axis has labeled tick marks at:
* 500M (500 million)
* 1G (1 billion)
* 1.5G (1.5 billion)
* **Data Series:** A single blue line traces the learning rate value over the sample count. There is no legend, as only one series is present.
* **Visual Style:** The graph has a clean, minimal design with a white background. Horizontal grid lines are present only at the labeled y-axis ticks.
### Detailed Analysis
The learning rate schedule follows a three-phase pattern:
1. **Warm-up Phase (Approx. 0 to ~50M samples):** The line starts at a value near 0 (approximately 0.0001) and rises very steeply to a peak of **0.0008**. It holds at this peak for a very short, flat segment.
2. **Constant Phase (Approx. ~50M to ~1G samples):** The learning rate drops sharply from 0.0008 to **0.0006**. It then remains perfectly constant at 0.0006 for the majority of the training run, from roughly 50 million samples until just before the 1 billion sample mark.
3. **Decay Phase (Approx. ~1G to 1.5G+ samples):** Beginning at approximately 1 billion samples, the learning rate begins a steady, linear decline. The slope is constant. By the 1.5G sample mark, the learning rate has decreased to approximately **0.0004**. The line continues decaying past this point, ending at a final data point (marked with a small dot) at approximately **0.00027**.
**Trend Verification:** The visual trend is clear: a rapid initial increase, a long plateau, and then a consistent downward slope. The extracted numerical values align with this visual progression.
### Key Observations
* **Scale of Training:** The x-axis scale (in billions of samples) indicates this schedule is for an extremely large-scale model training run.
* **Abrupt Transitions:** The transitions between phases (warm-up to constant, constant to decay) are sharp and immediate, not gradual.
* **Final Value:** The learning rate does not decay to zero within the visible graph; it ends at a non-zero value (~0.00027), suggesting training may continue or this is the final scheduled rate.
* **Minimalist Design:** The graph contains only the essential elements (axes, labels, line) without additional annotations, markers, or a legend.
### Interpretation
This graph depicts a **"warmup + constant + linear decay"** learning rate schedule, a standard technique in training deep neural networks, particularly large language models.
* **Purpose of Phases:**
* **Warm-up:** The initial rapid increase helps stabilize training early on when model weights are random, preventing large, destabilizing gradient updates.
* **Constant Phase:** The long plateau at 0.0006 allows the model to learn steadily and efficiently over the bulk of the training process.
* **Linear Decay:** The final decay phase fine-tunes the model. Gradually reducing the learning rate helps the model settle into a good minimum in the loss landscape, improving final performance and generalization.
* **Underlying Logic:** The schedule balances exploration (higher learning rates early on) with exploitation (lower learning rates later for precise convergence). The specific values (peak of 0.0008, plateau at 0.0006) and the timing of transitions (at ~1G samples) are critical hyperparameters tuned for this specific model and dataset.
* **Scale Context:** The use of "G" (billions) for samples underscores the massive computational scale of modern AI training. This single graph represents a training run that likely required thousands of GPU/TPU hours.