\n
## Diagram: Cellular Automata Evolution
### Overview
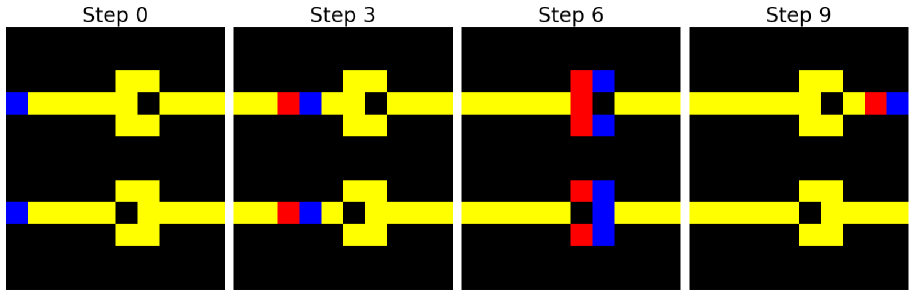
The image depicts the evolution of a one-dimensional cellular automaton over four discrete time steps: 0, 3, 6, and 9. The automaton consists of a linear array of cells, with each cell existing in one of three states: black, yellow, red, or blue. The diagram illustrates how the state of each cell changes based on the states of its neighboring cells according to a specific rule.
### Components/Axes
The diagram is organized into four panels, each representing a time step. Each panel shows two rows of cells. The horizontal axis represents the cell position along the linear array. There are no explicit axes labels, but the time step is indicated above each panel ("Step 0", "Step 3", "Step 6", "Step 9"). The cells are represented as colored squares. The colors represent the cell states:
* **Yellow:** Represents the background or default state.
* **Black:** Represents an active or 'on' state.
* **Red:** Represents a transient state.
* **Blue:** Represents a transient state.
### Detailed Analysis
**Step 0:**
* Two black cells are present, each surrounded by yellow cells.
* A blue segment is present on the left side of the top row.
* A red segment is present on the right side of the top row.
* A blue segment is present on the left side of the bottom row.
* A red segment is present on the right side of the bottom row.
**Step 3:**
* The black cells have remained in the same positions.
* The blue segments have moved one cell to the right.
* The red segments have moved one cell to the left.
**Step 6:**
* The black cells have remained in the same positions.
* The blue segments have merged into a single two-cell block.
* The red segments have merged into a single two-cell block.
* The blue and red blocks are positioned adjacent to the black cells.
**Step 9:**
* The black cells have remained in the same positions.
* The blue segments have moved one cell to the right.
* The red segments have moved one cell to the left.
* The blue and red segments are now positioned in the same locations as in Step 0.
### Key Observations
* The black cells remain stationary throughout the simulation.
* The red and blue segments move in opposite directions, with red moving left and blue moving right.
* The pattern repeats every three steps, suggesting a periodic behavior.
* The red and blue segments appear to 'orbit' the black cells.
### Interpretation
This diagram illustrates a simple one-dimensional cellular automaton. The automaton's behavior is governed by a set of rules that determine how the state of each cell changes based on the states of its neighbors. The observed periodic behavior suggests that the automaton is operating in a stable regime. The movement of the red and blue segments around the black cells could represent the propagation of information or energy within the system. The automaton's simplicity allows for easy visualization and analysis of complex emergent behaviors. The diagram demonstrates how simple rules can lead to complex patterns and dynamics. The repeating pattern suggests a conserved quantity within the system, possibly related to the number of red and blue cells. The black cells act as fixed points or attractors, influencing the movement of the other cell states.